
Honeynet in Azure
Summary
A mini honeynet within Azure in which Log Analytics workspace and Microsoft Sentinel were used to map attacks, alerts and incidents.
Introduction
In this project, I build a mini honeynet in Azure and ingest log sources from various resources into a Log Analytics workspace, which is then used by Microsoft Sentinel to build attack maps, trigger alerts, and create incidents.
I measured some security metrics in the insecure environment for 24 hours, applied some security controls to harden the environment, measured metrics for another 24 hours, then compared the results (shown below). The metrics we will show are:
- SecurityEvent (Windows Event Logs)
- Syslog (Linux Event Logs)
- SecurityAlert (Log Analytics Alerts Triggered)
- SecurityIncident (Incidents created by Sentinel)
- AzureNetworkAnalytics_CL (Malicious Flows allowed into the honeynet)
Structure
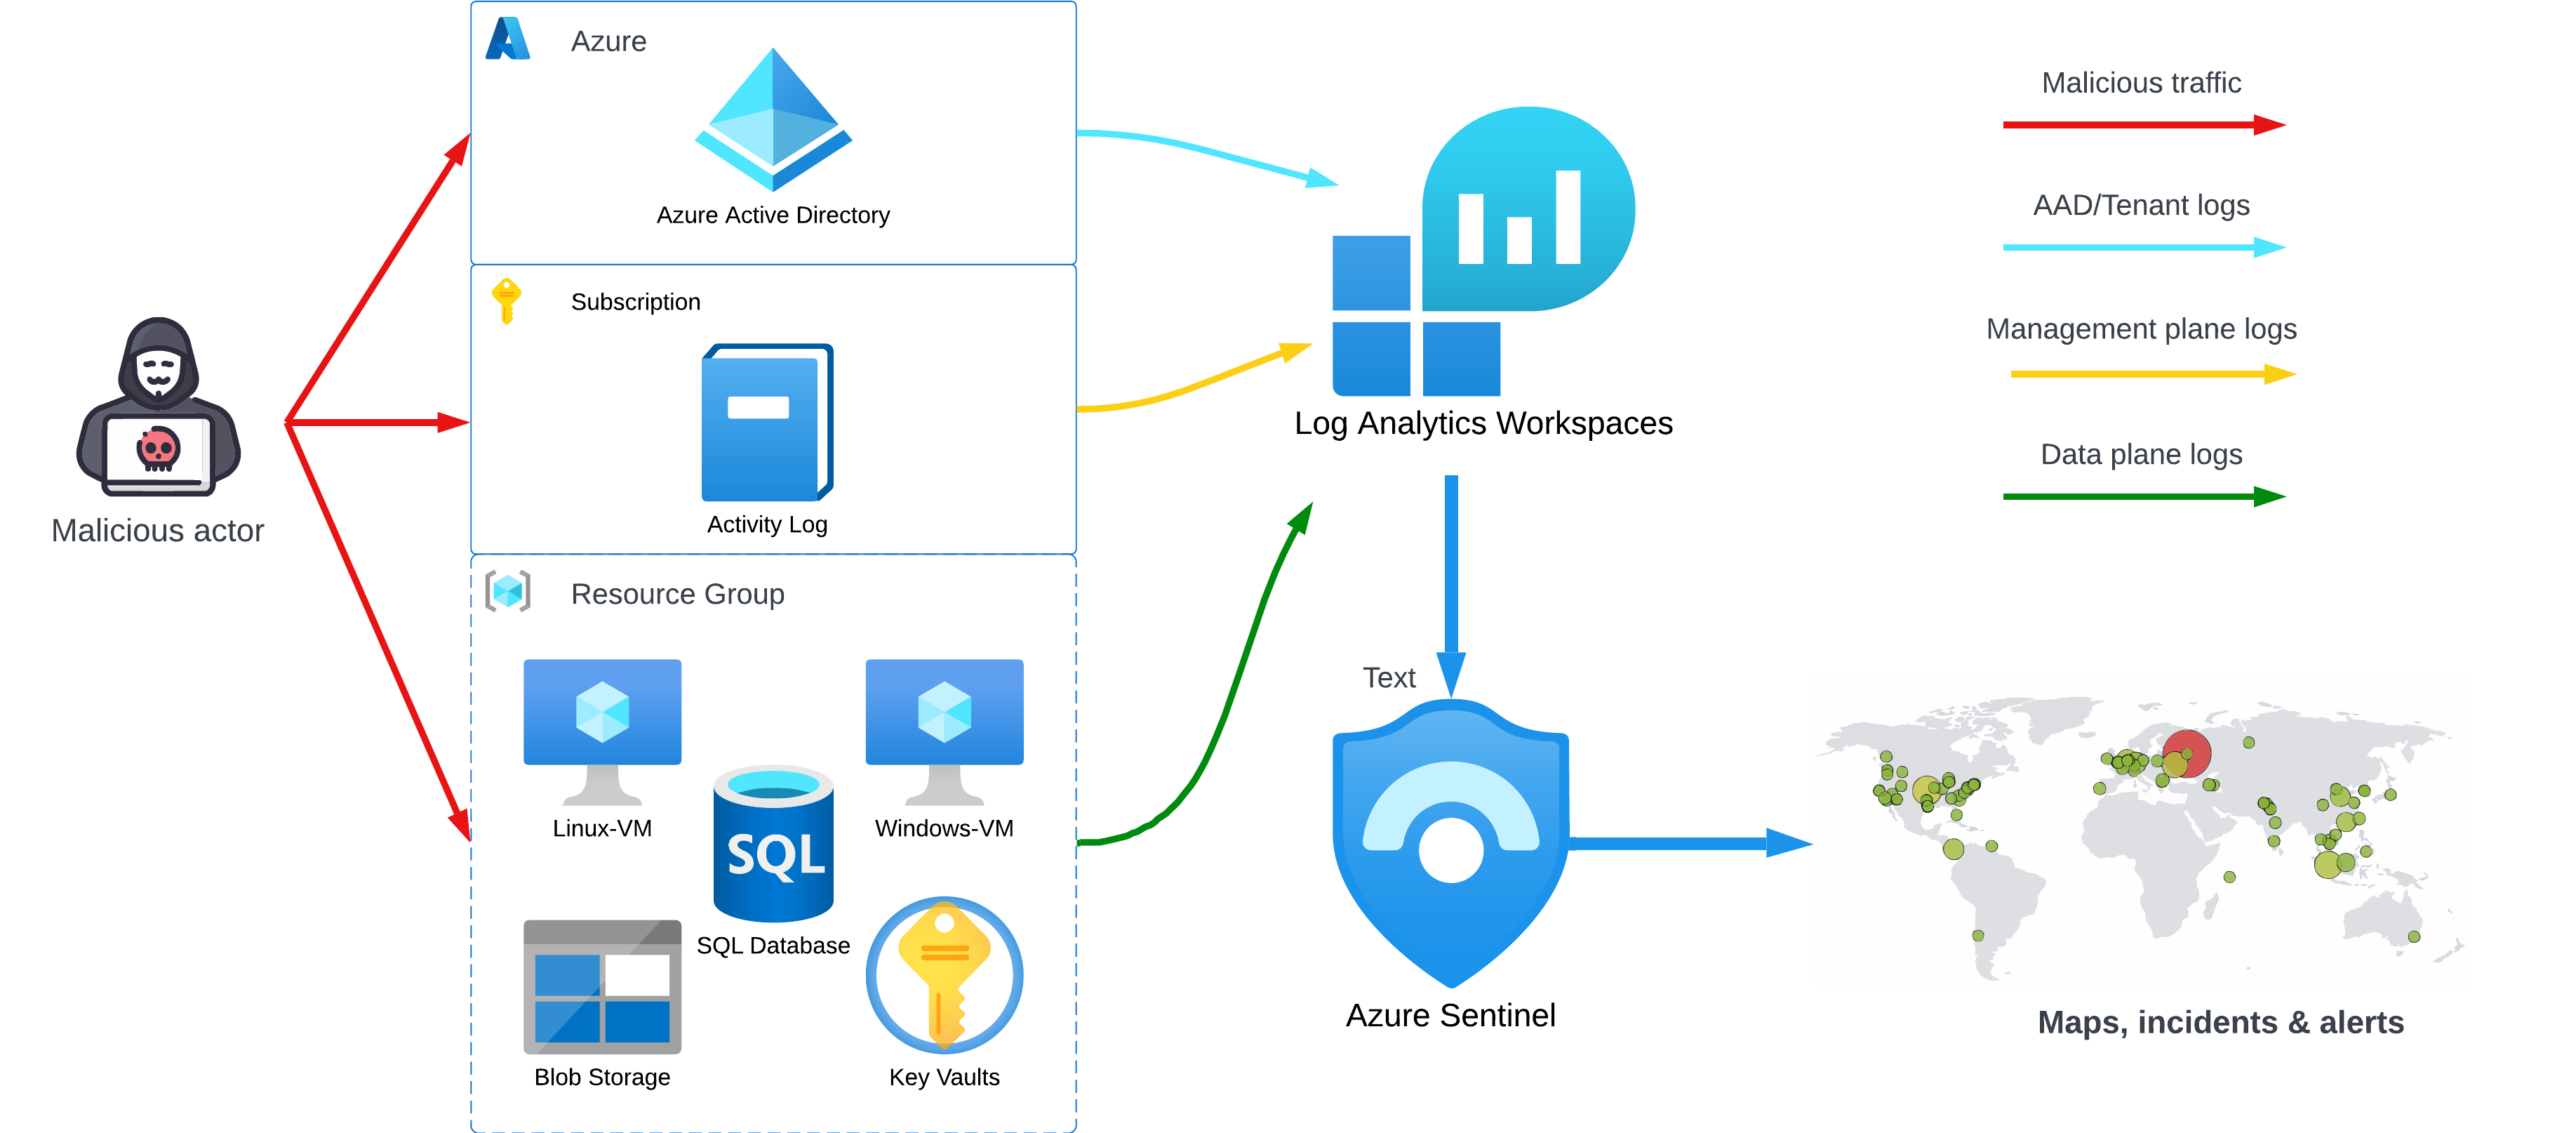
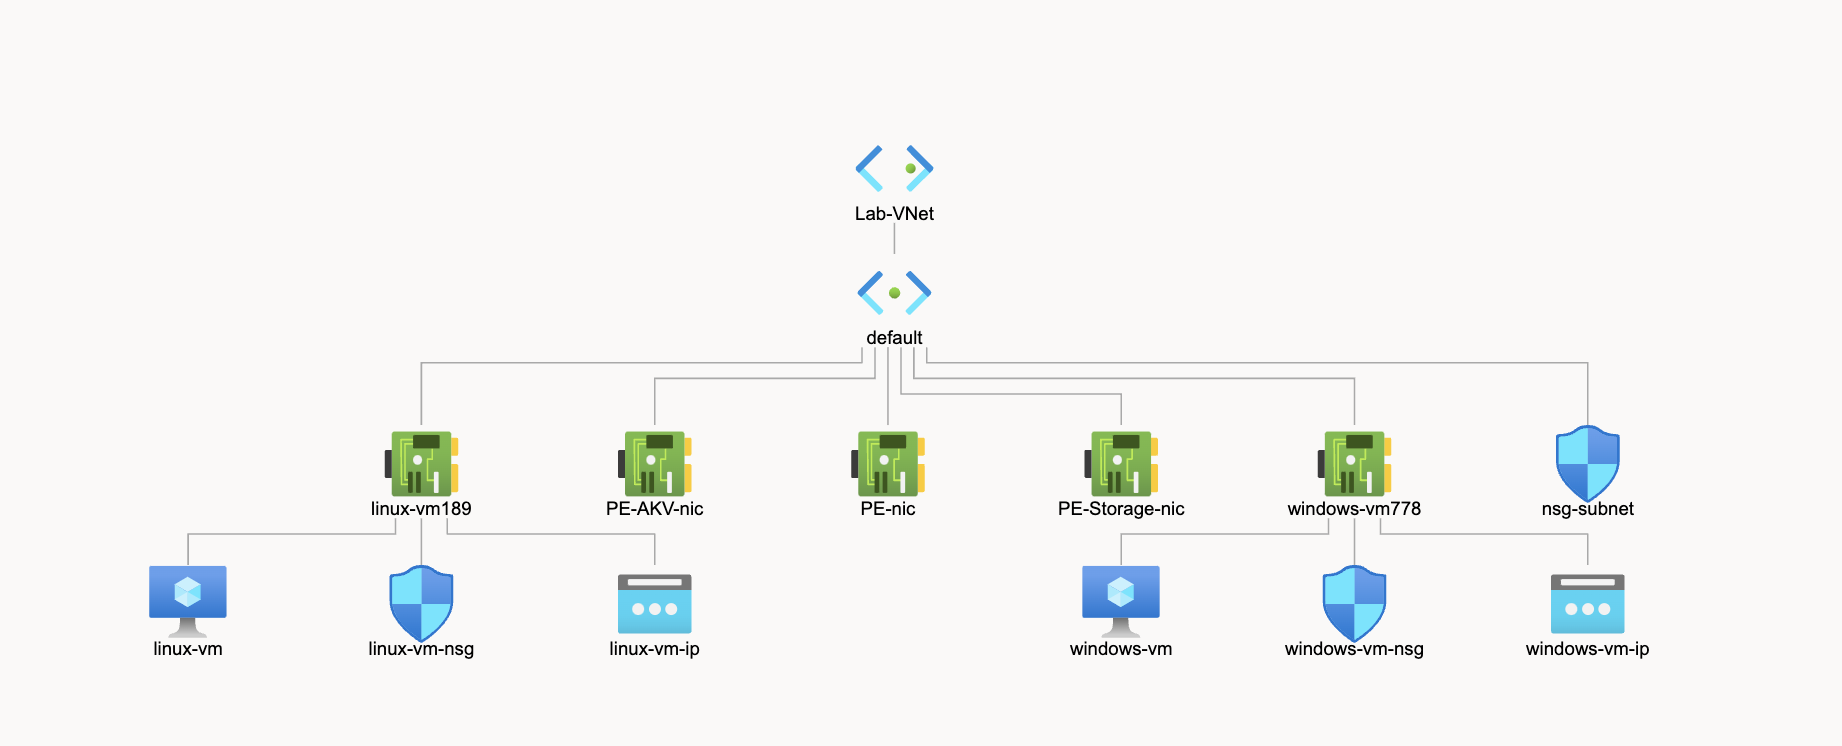
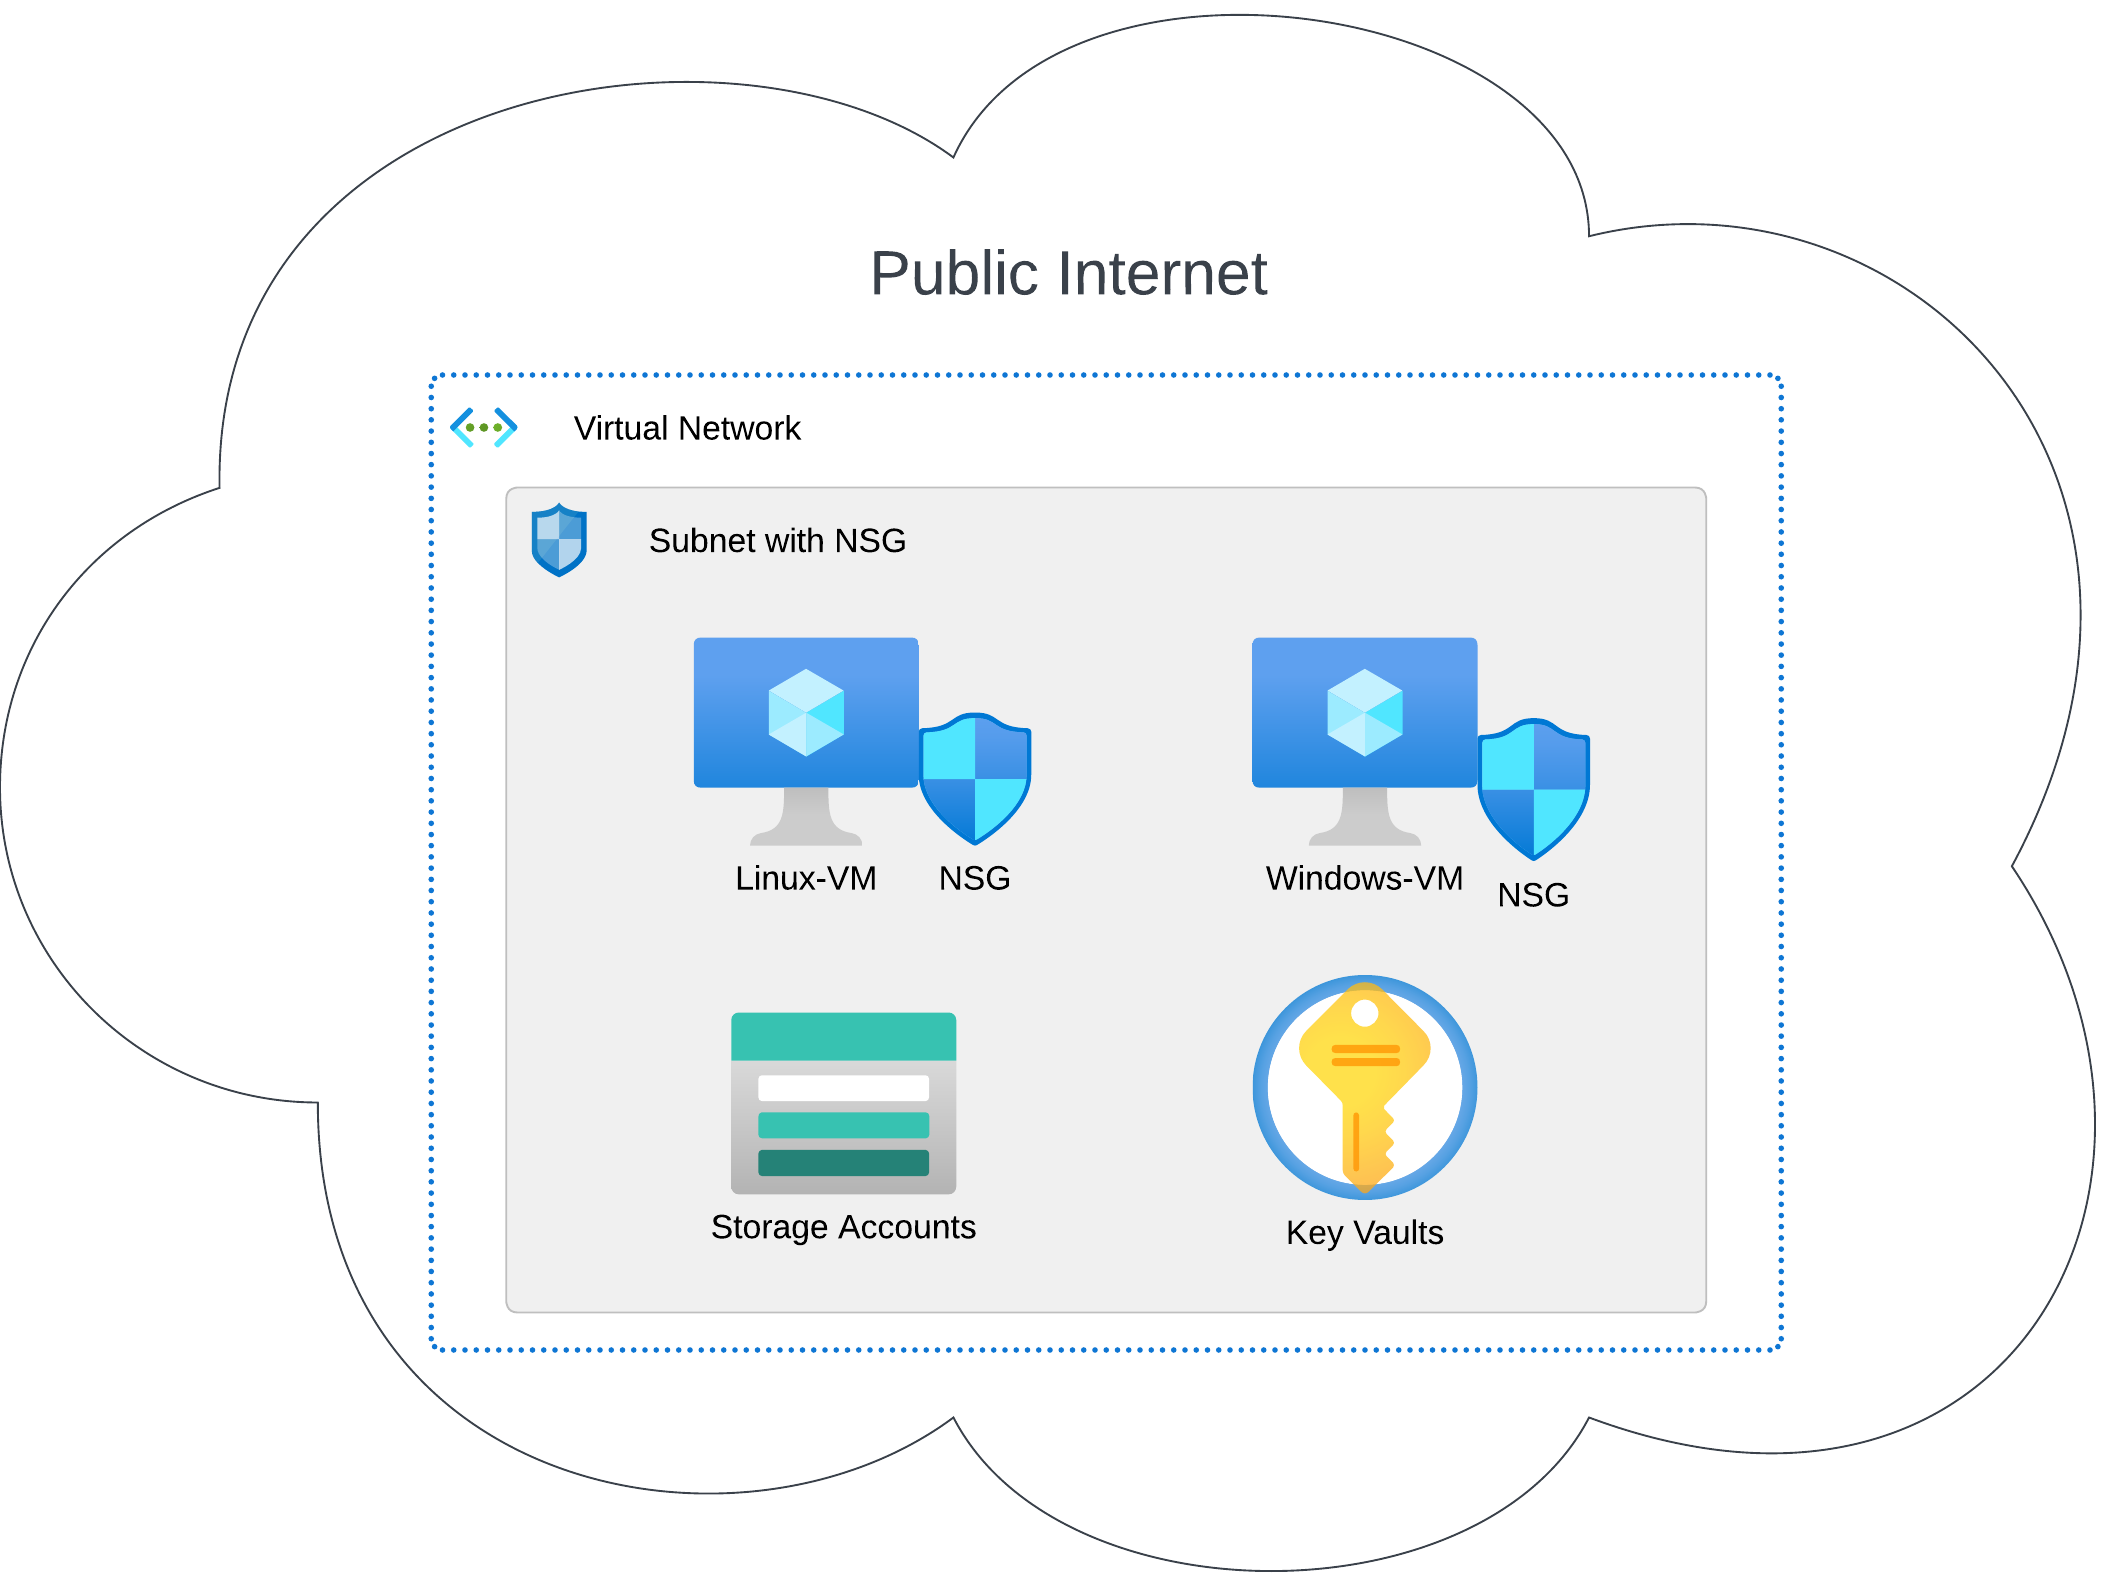
The architecture of the mini honeynet in Azure consists of the following components:
- Virtual Network (VNet)
- Network Security Group (NSG)
- Virtual Machines (2 windows, 1 linux)
- Log Analytics Workspace
- Azure Key Vault
- Azure Storage Account
- Microsoft Sentinel
Steps
This section contain a high-level overview of the steps taken while undertaking this project. Many of the specific configuration steps envolved are well documented and subject to update by Microsoft. Therefore, I will attempt to be as thorough as possible without cluttering the page with nitty-gritty details that can easily be looked up elsewhere.
Step 1: Creating Azure subscription and first resources
Firstly, I created an Azure Account and Subscription, which offers
a period of free service and a $200 credit for paid services
in the first 30 days – more than enough for this endeavour. It
was aptly named Azure Subscription 1.
Under the subscription I created a resource group and established a
virtual network, RG-Cyber-Lab and Lab-VNet,
respectively.
Within the same resource group, virtual network, and region (East US 2),
I created two virtual machines, one running Windows 10, and another
running Ubuntu Server 20.04 – respectively named windows-vm
(in which I installed SQL Server Management Studio) and linux-vm.
Step 2: Introducing vulnerabilities
In a different resource group and region – RG-Cyber-Lab-Attacker,
in Australia East
I instantiated a Windows 10 virtual machine named attack-vm,
from which I could eventually simulate brute-force attacks against the other VMs.
Next, it was time to work on the Network Security Groups and open our VMs to all incoming inbound connections.
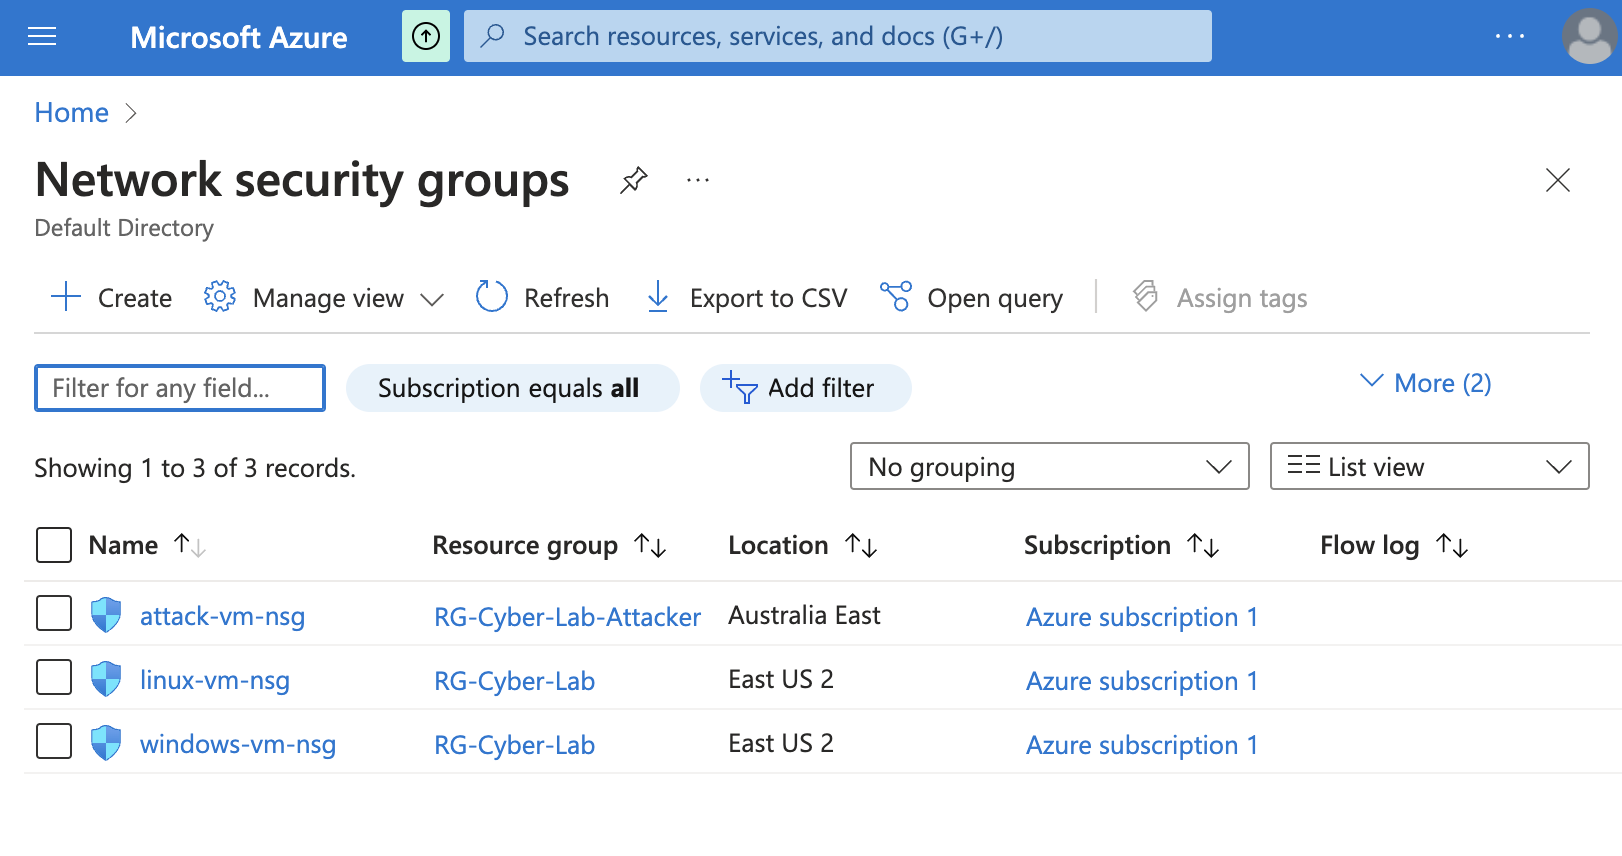
Within the NSGs of both the Windows and Linux VMs, I created I (high-priority) rule accepting all inbound traffic.
The screenshot below portrays this step regarding the linux-vmNSG:
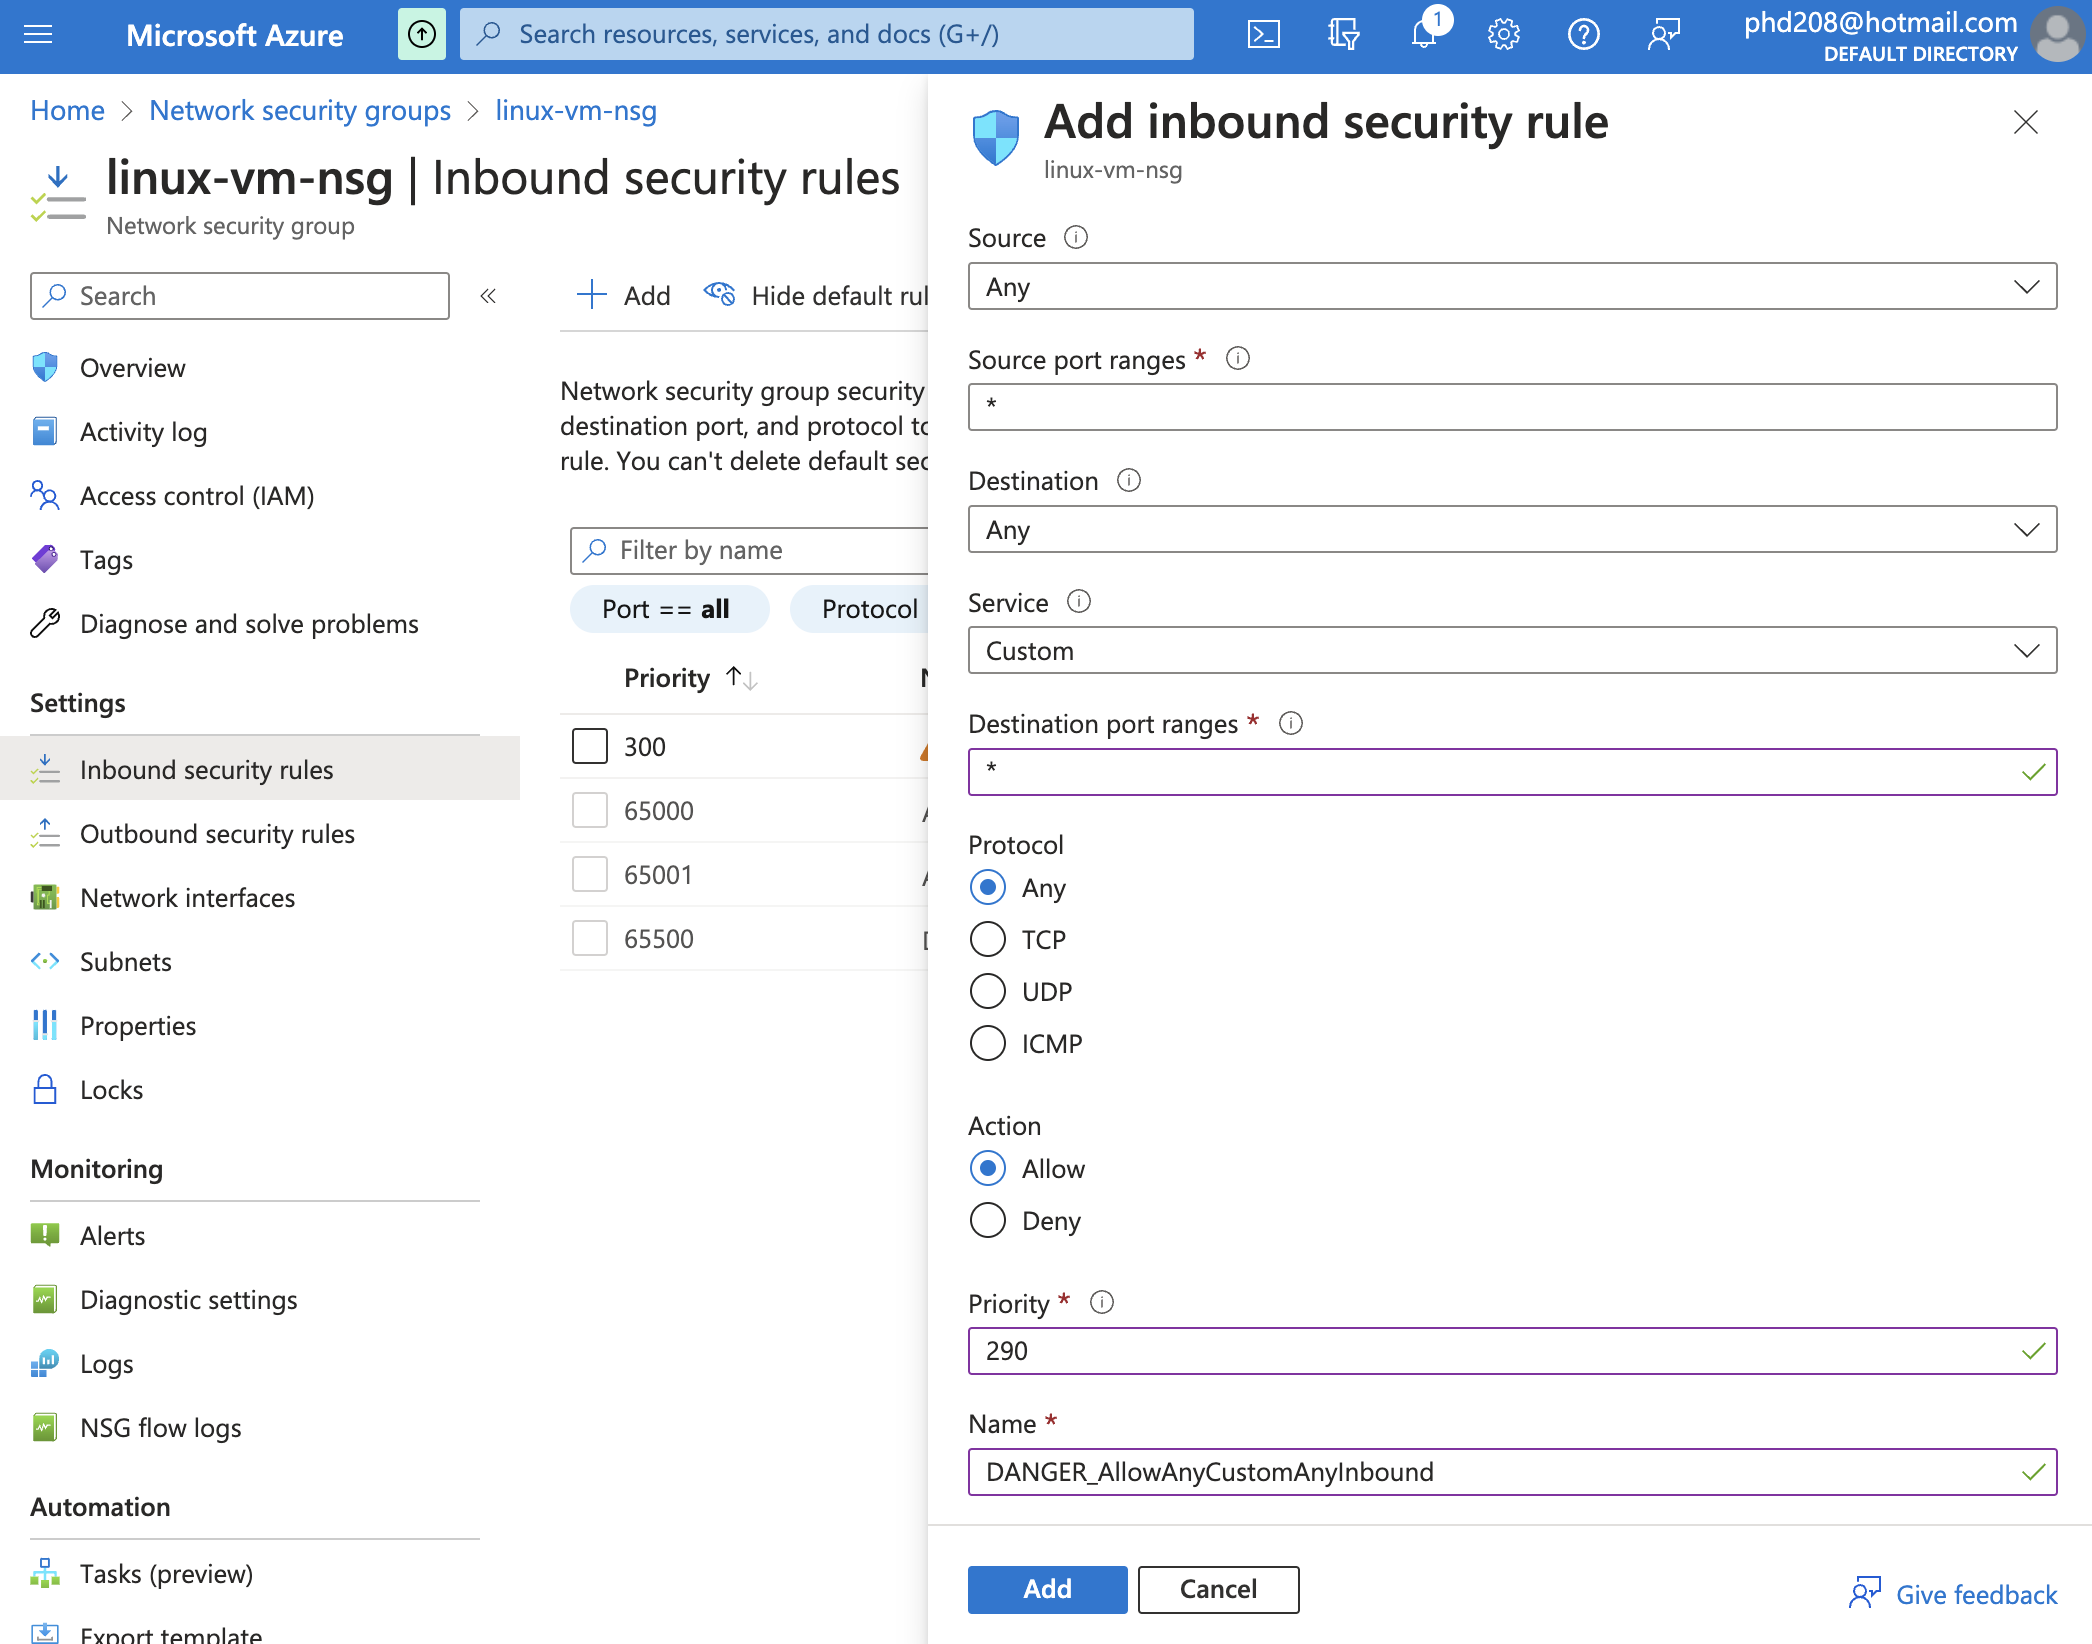
The same was done with the windows-vmNSG. To further increase
the Windows machine's permeability to network traffic, I disabled the Windows Defender
Firewall for all profiles (Domain, Private, Public, IPsec Settings).
Step 3: Preparation for logging and monitoring
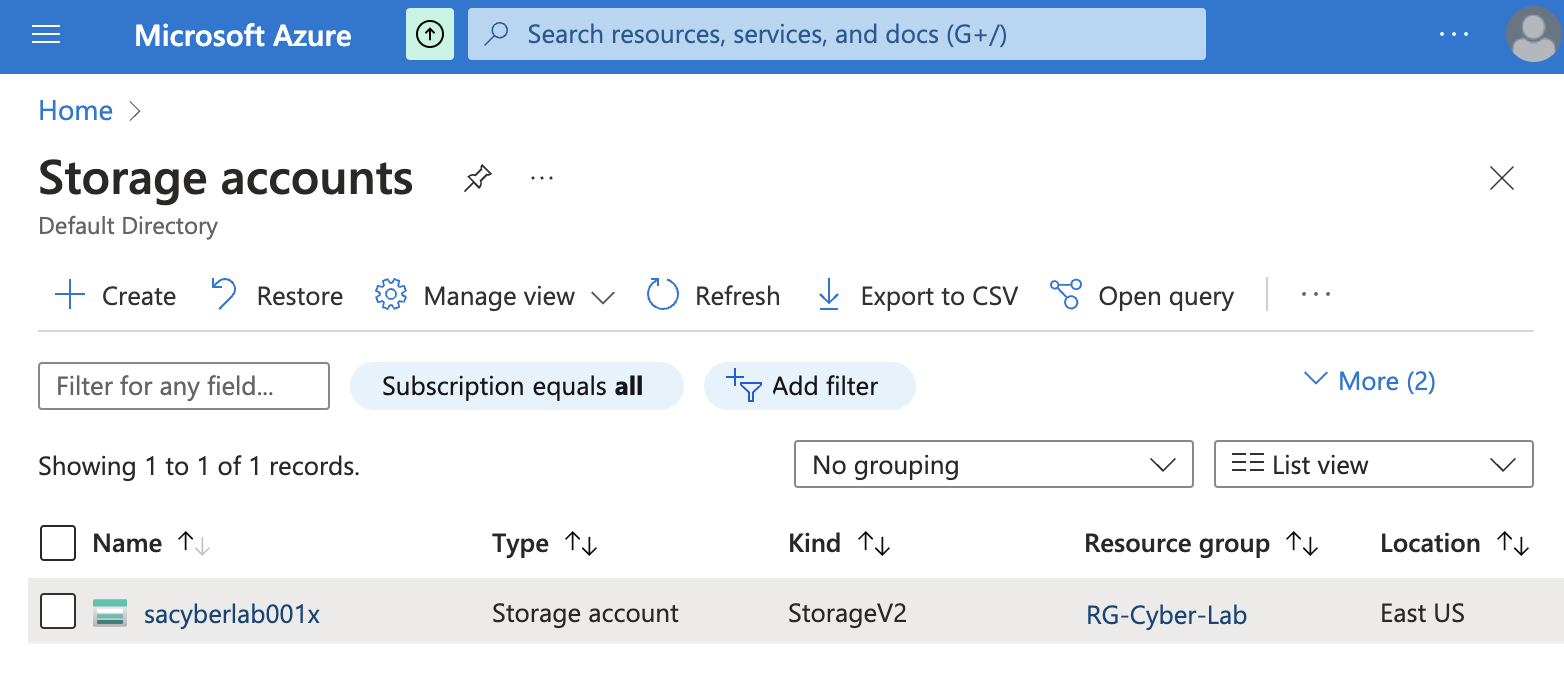
In preparation for the logging step, I created a storate account, dubbed sacyberlab0x,
which would serve the primary purpose of storing NSG flow logs – as well as
housing IP Geo-location information.
With the storage set up, the log flow can begin. That is accomplished with the creation of a Log Analytics Workspace and then activating Microsoft Defender for Cloud, within which flow logs from the virtual machines' NSG are enabled, as such:
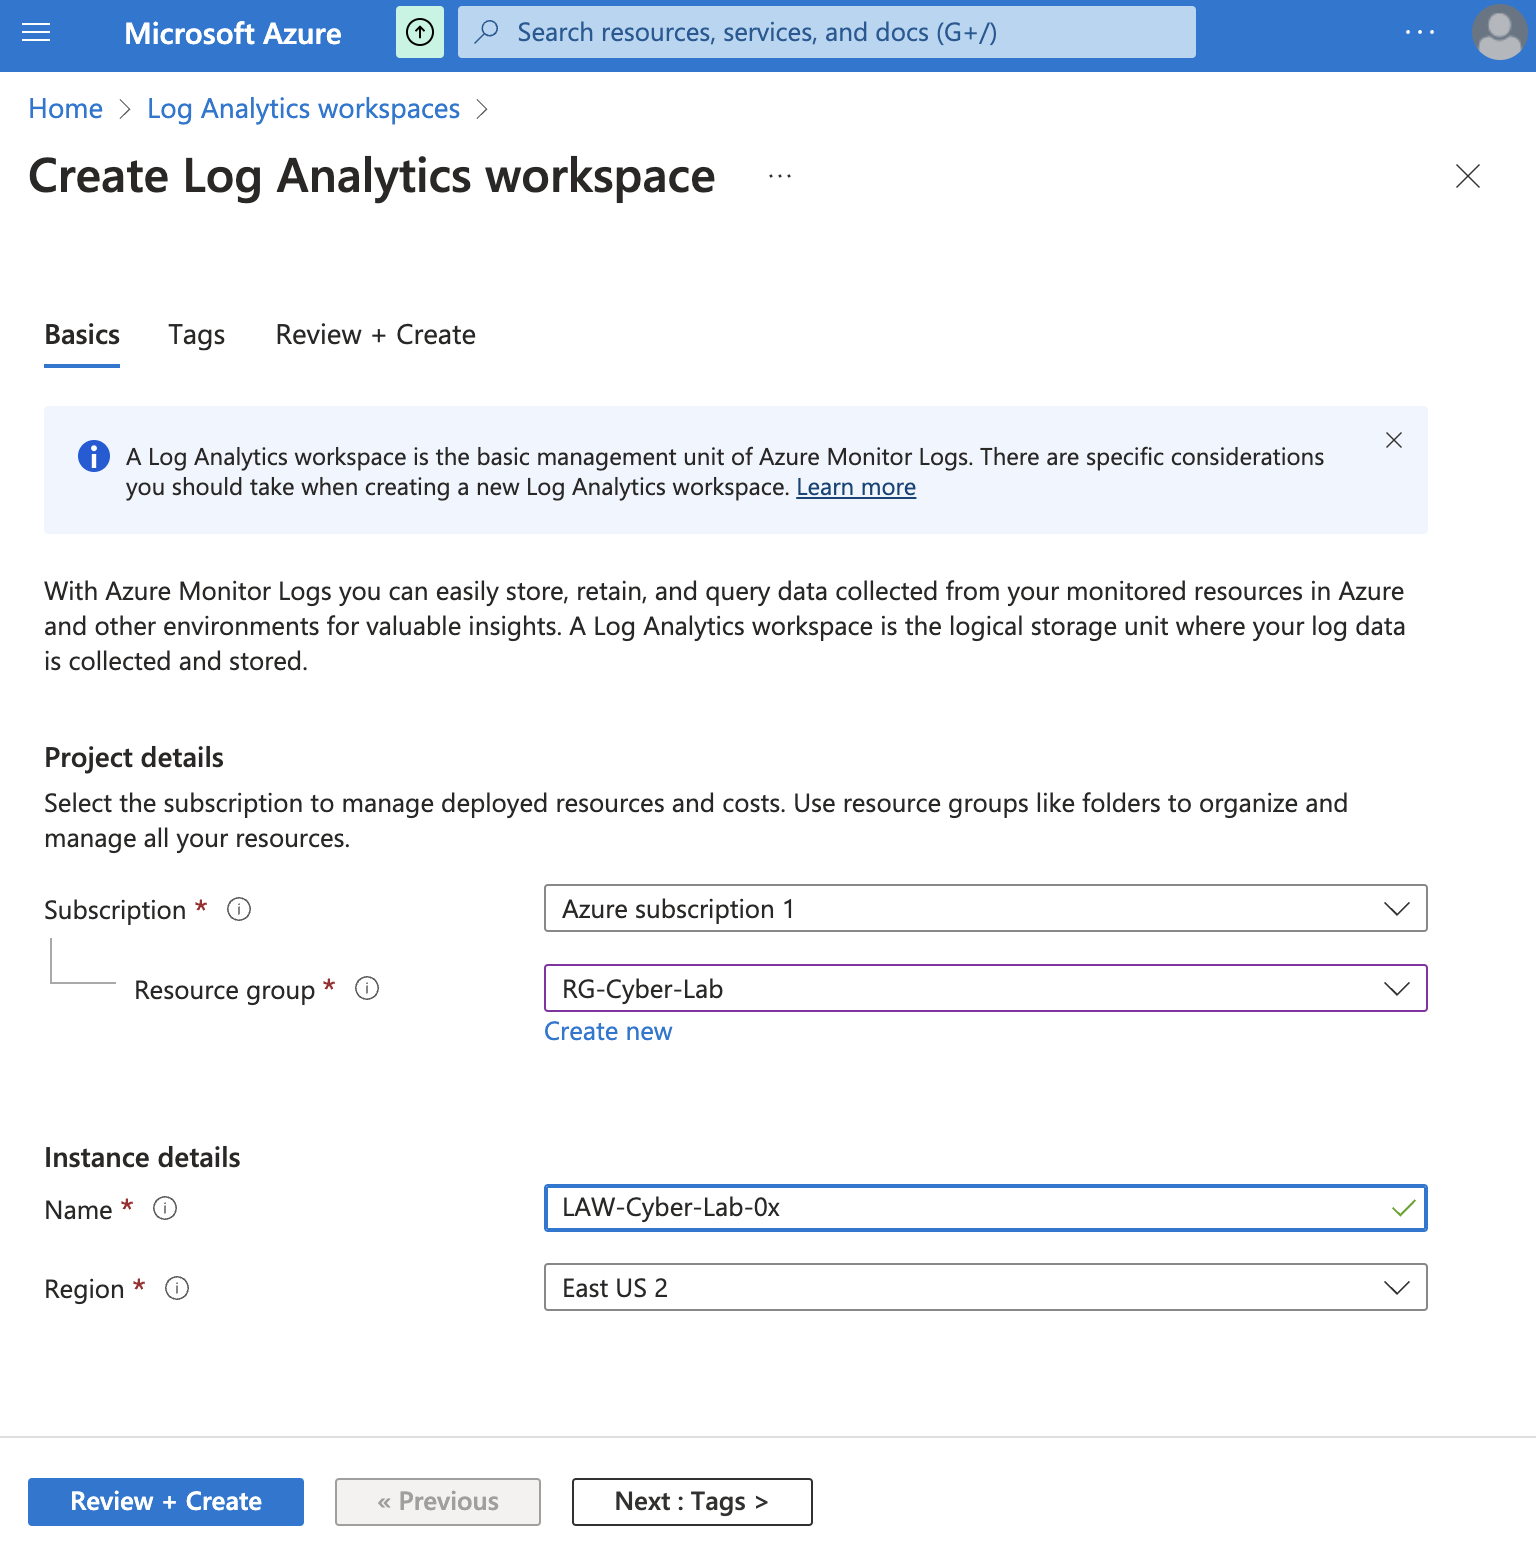
Step 3.1: Creating the Log Analytics Workspace
A Law Analytics Workspace is created under the same resource group and region as the NSGs from which it will receive logs.
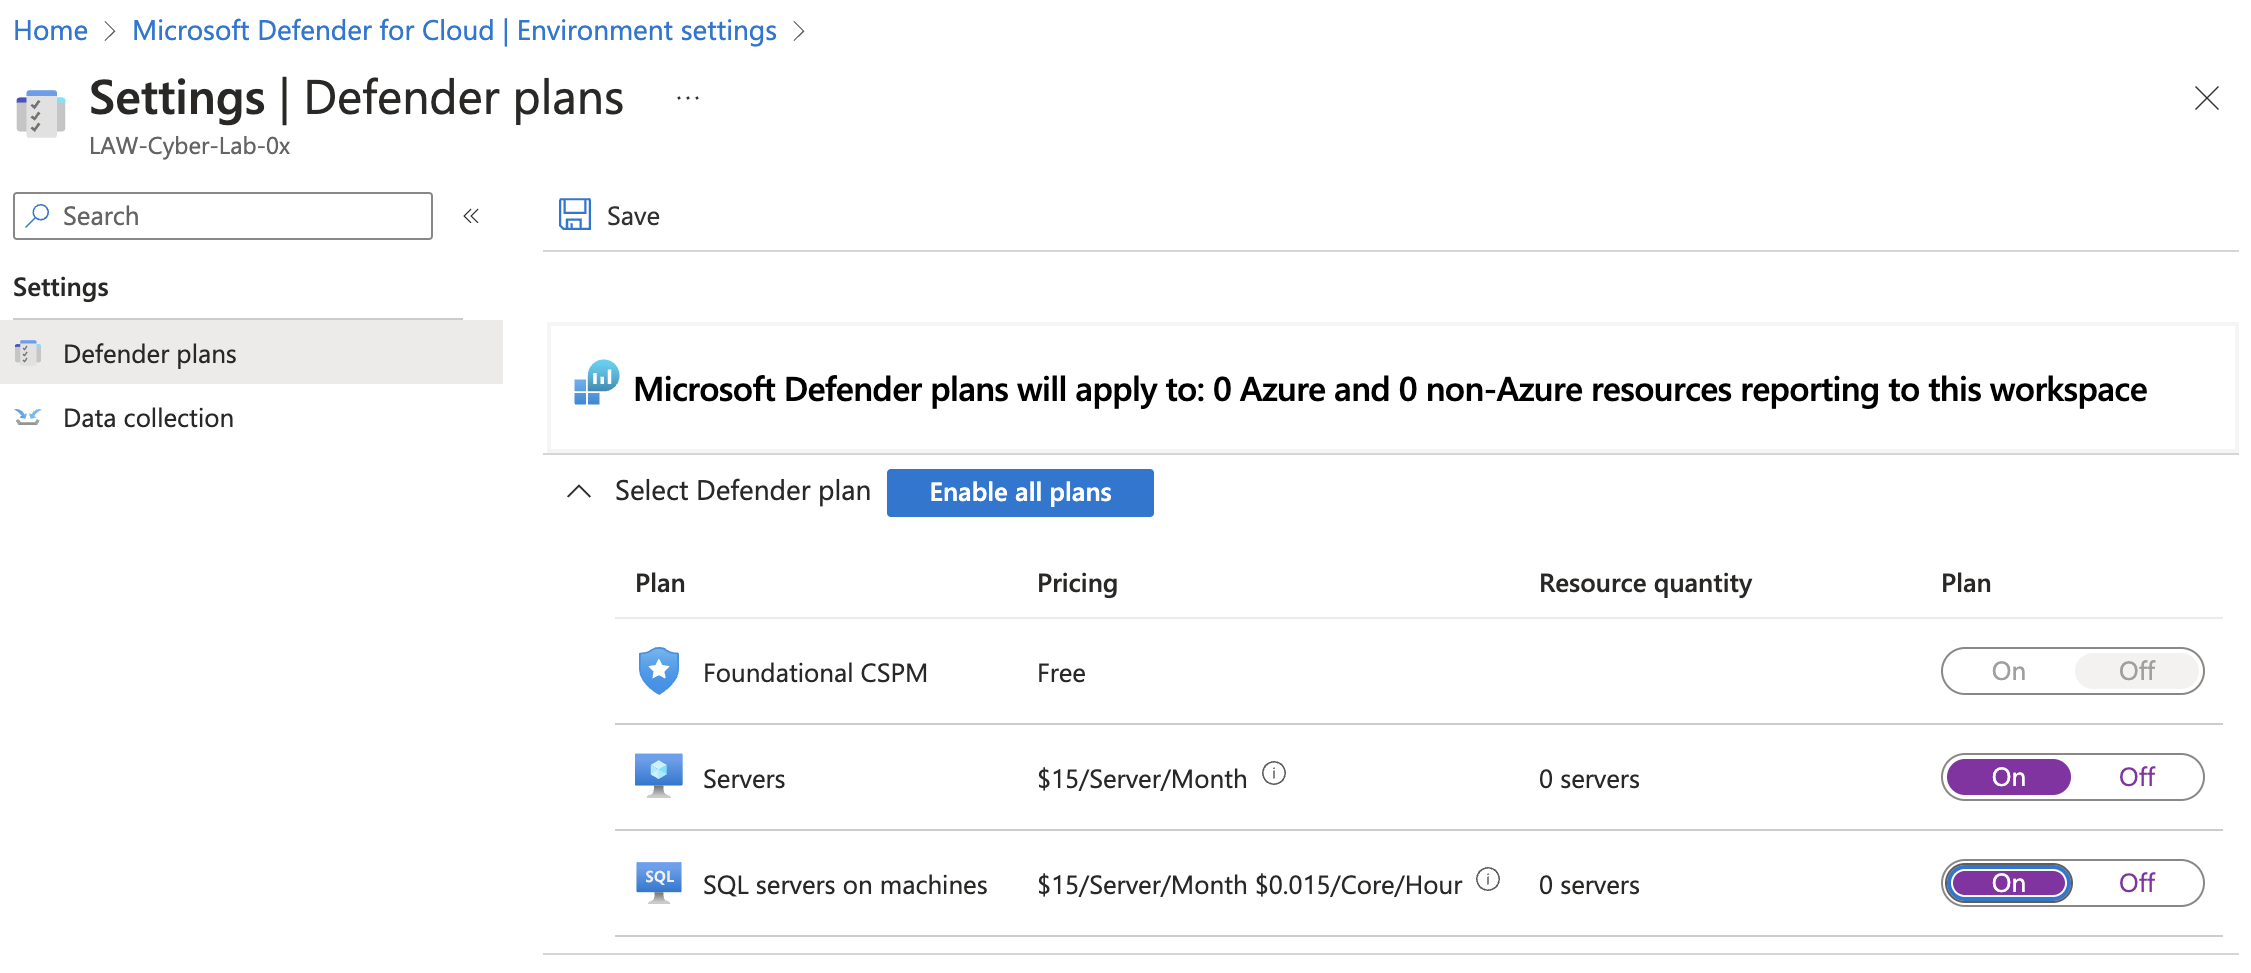
Step 3.2: Activating Microsoft Defender for Cloud
First, turn on Defender Plans for both VMs and SQL instances operated therein:
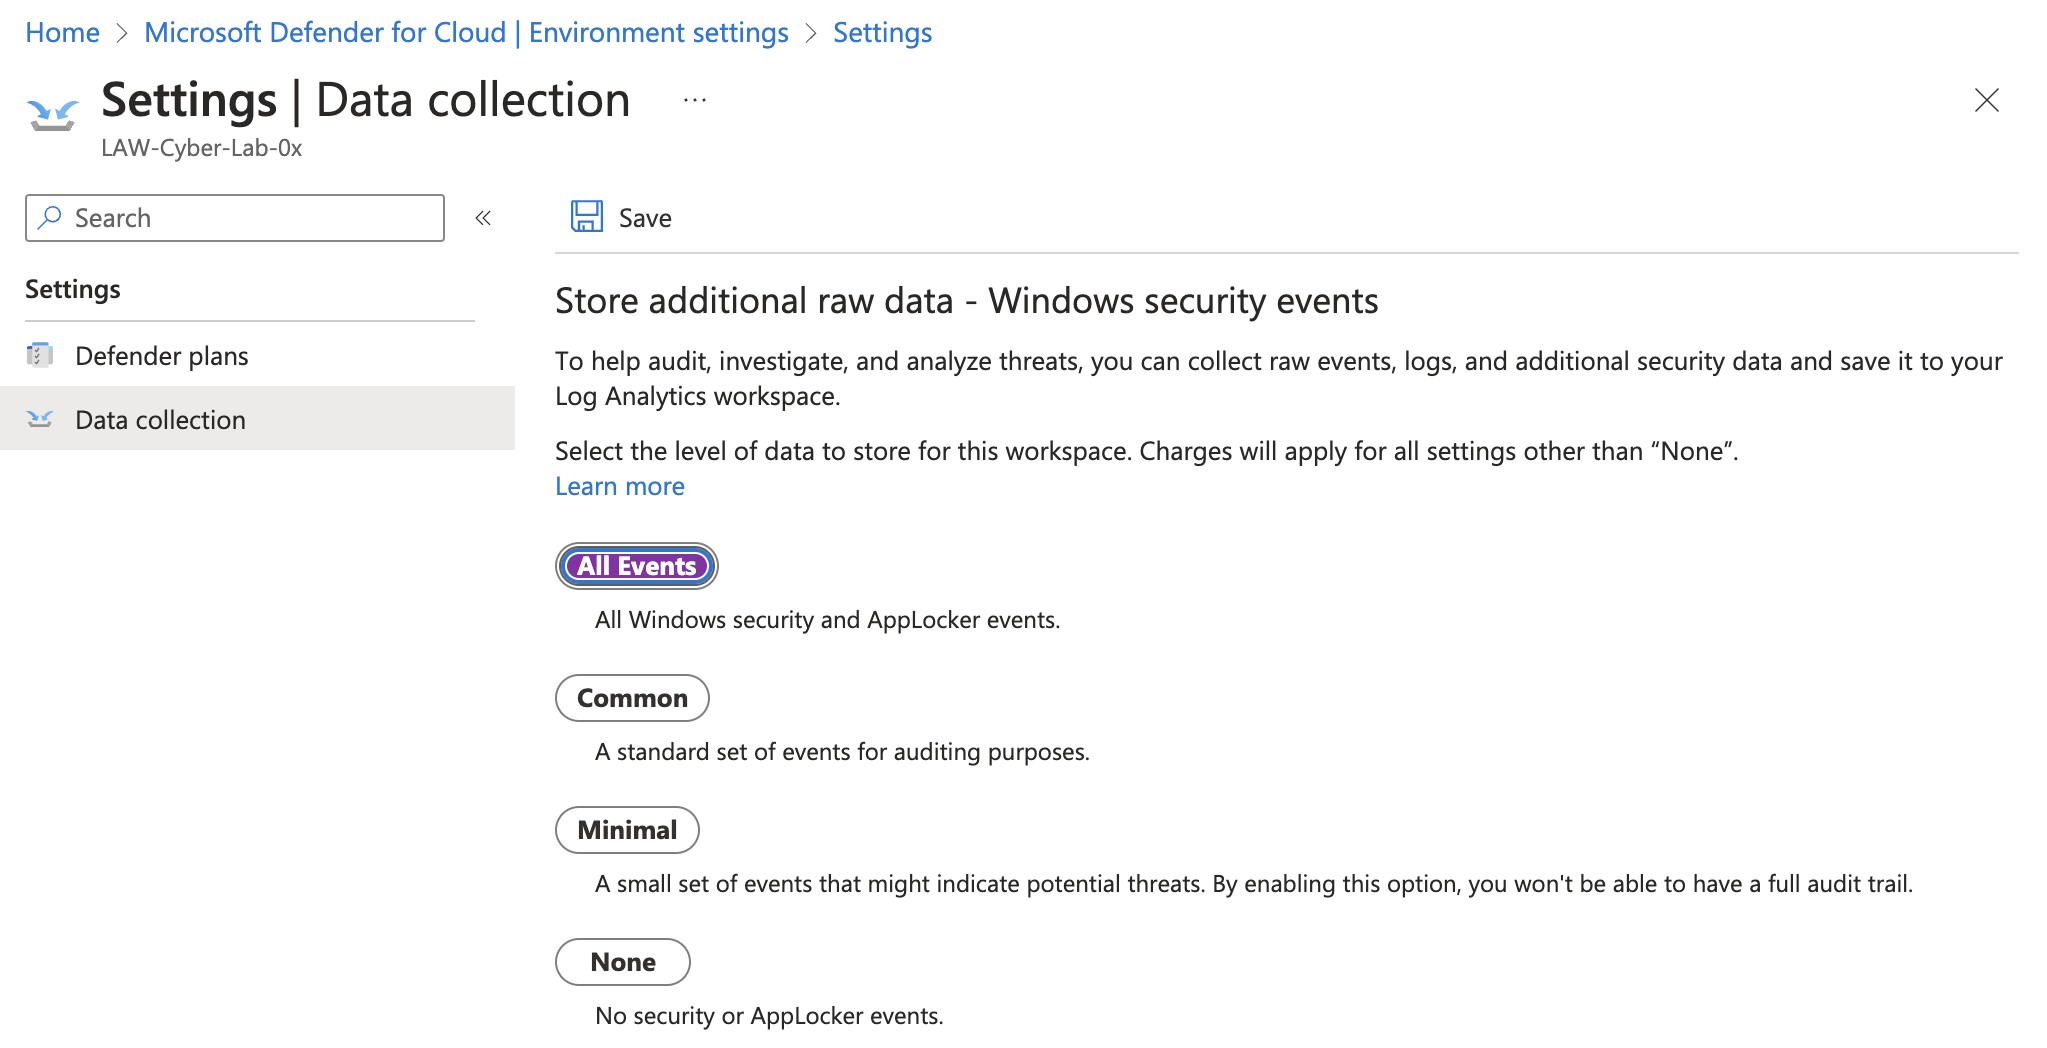
Then, initiate Data Collection for all event types for the windows-vm:
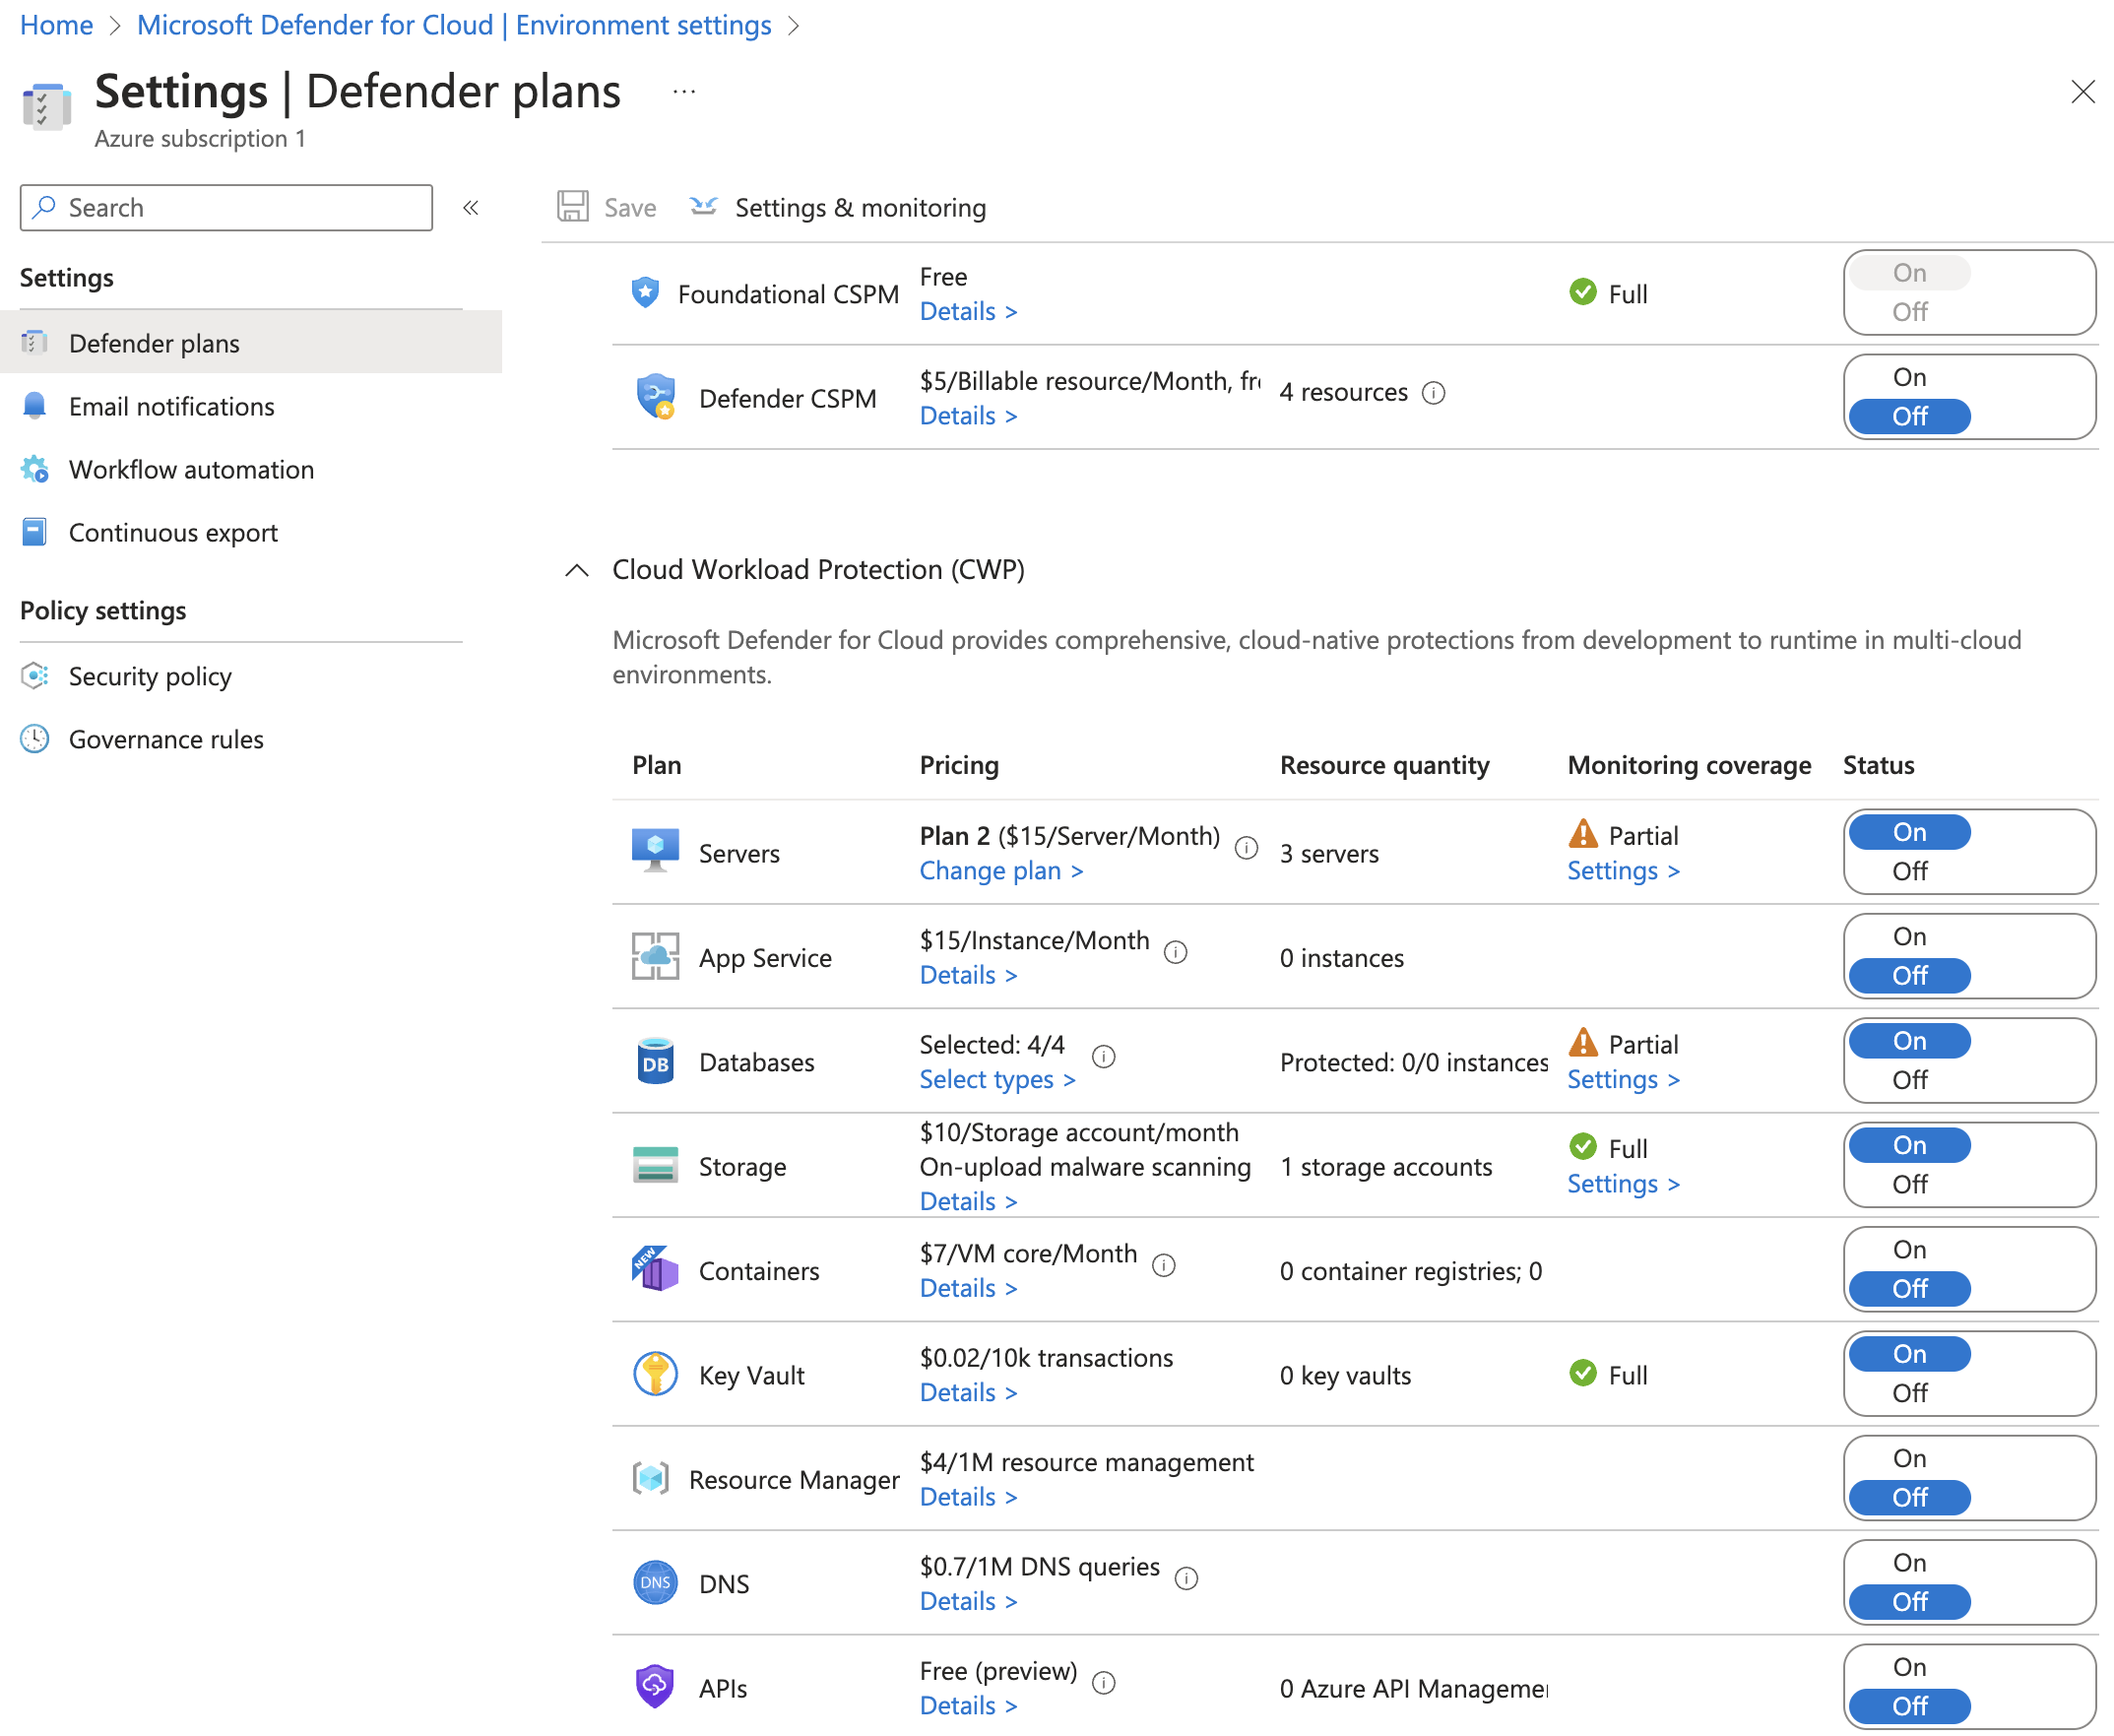
Step 3.3: Enabling Microsoft Defender for Cloud per subscription
Enabled Microsoft Defender for Cloud under the subscription set up in step 1, covering servers, databases, storage accounts, and the key vault.
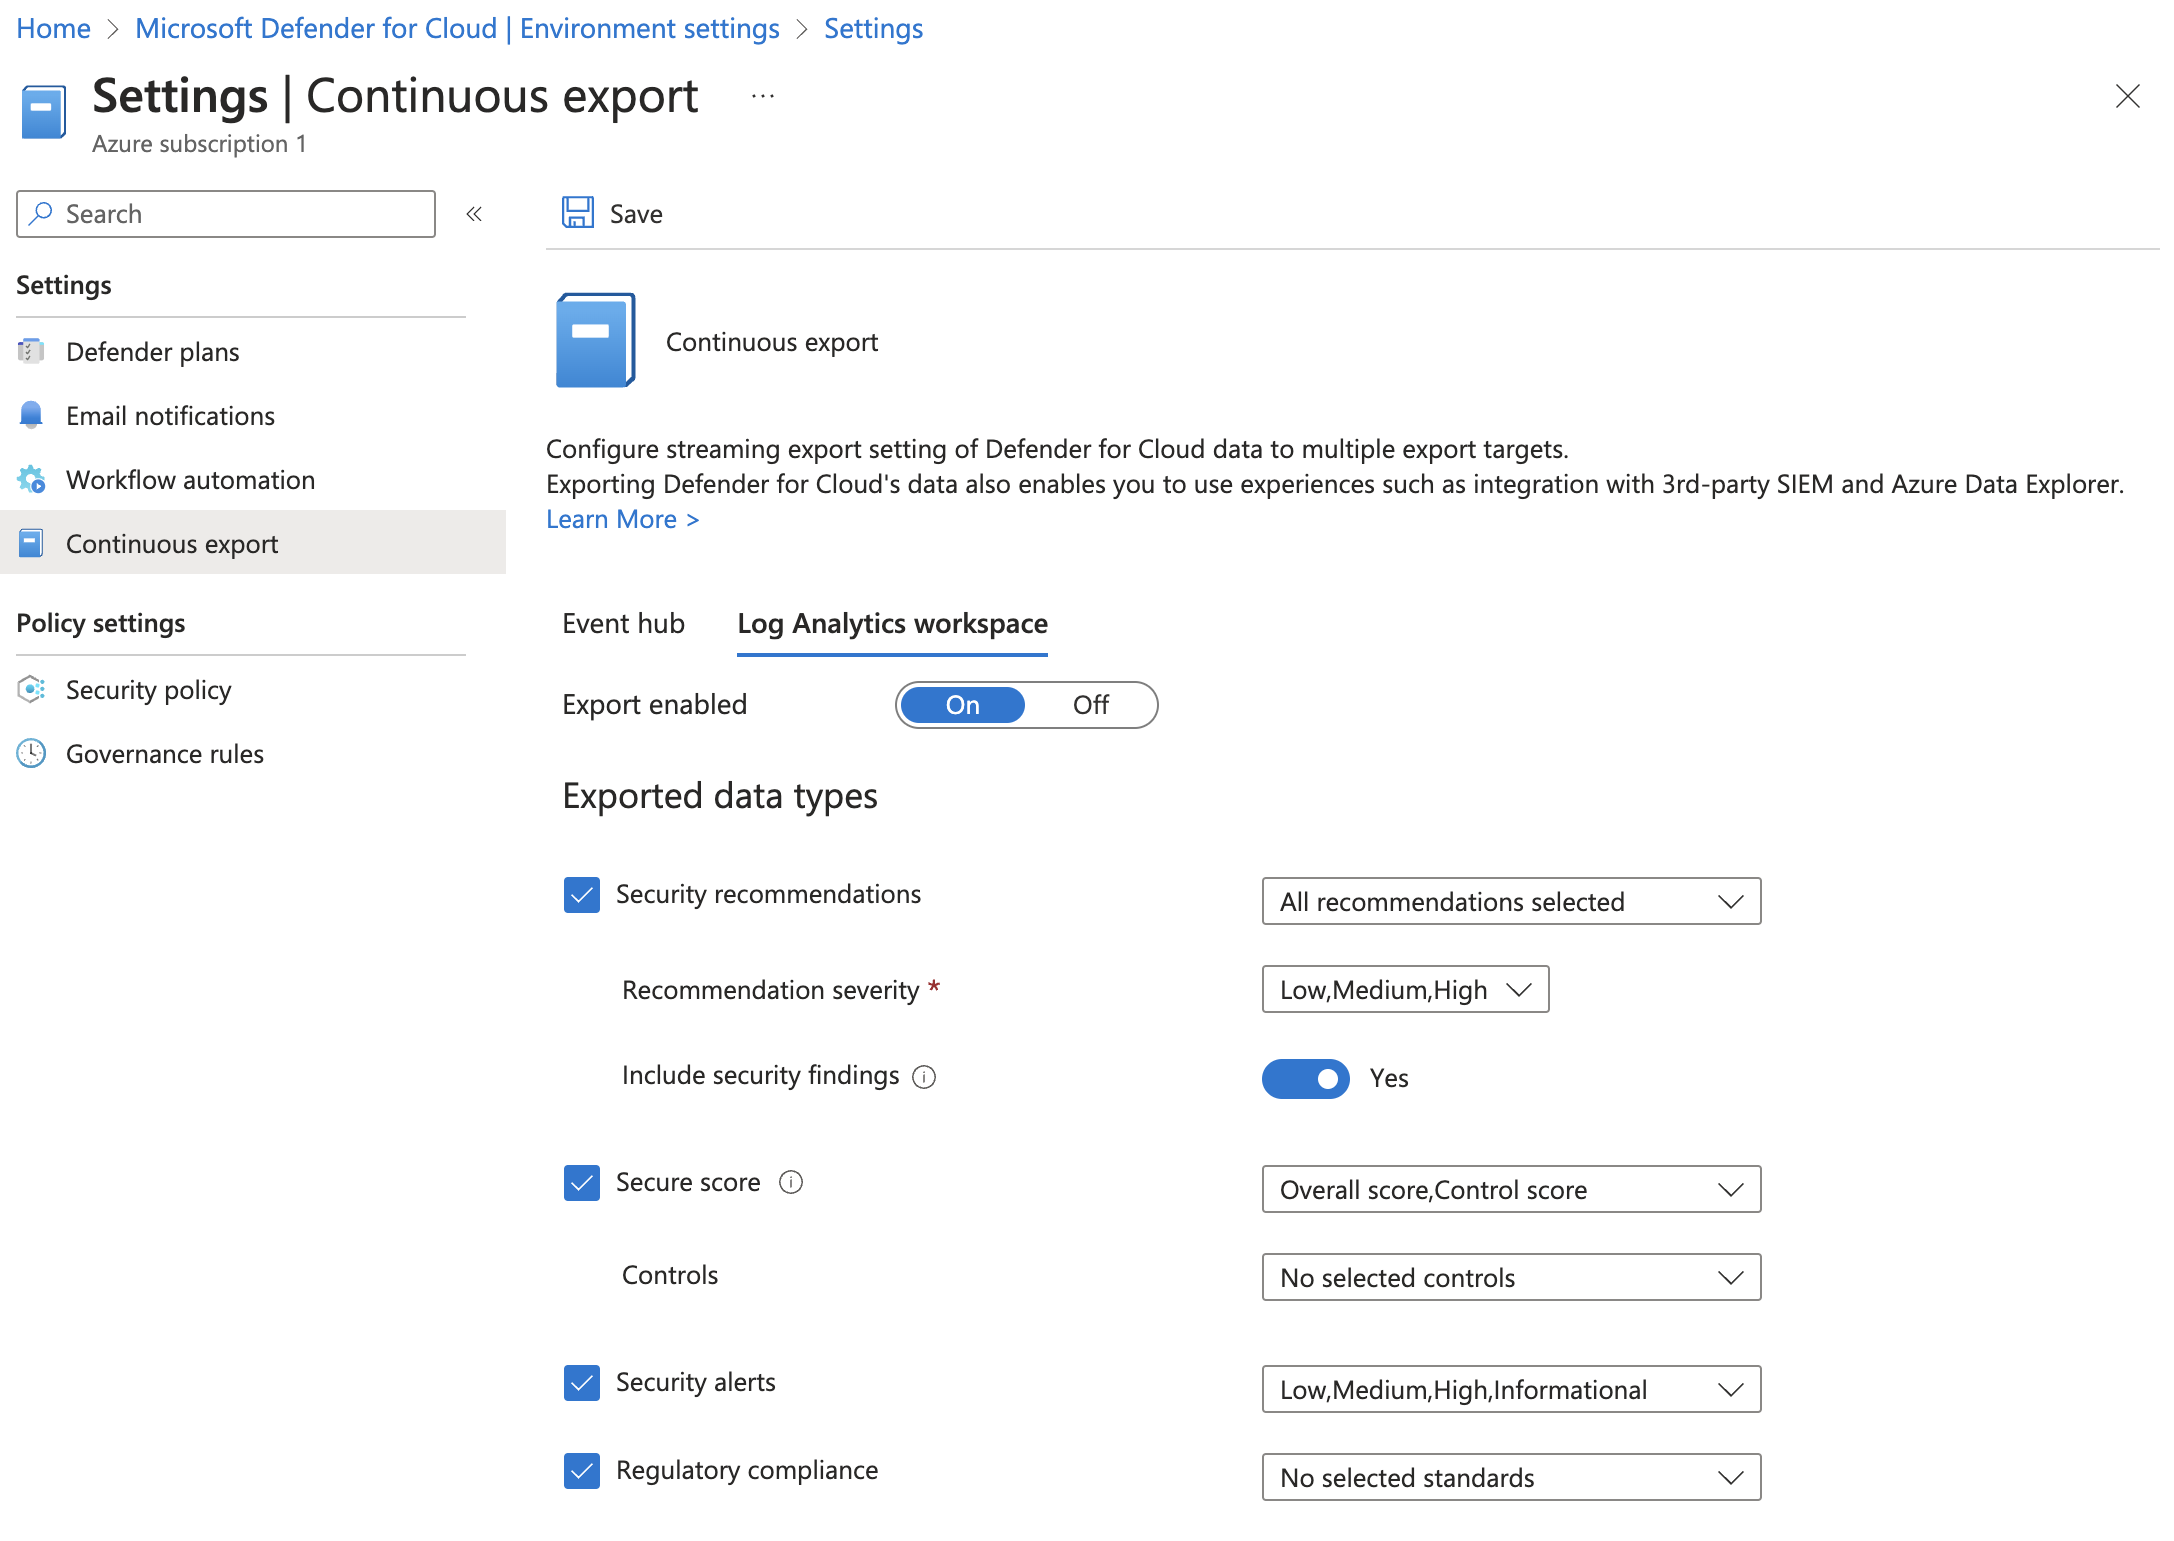
Step 3.4: Enabling Microsoft Defender for Cloud continuous export
Within environment settings, enabled MDC continous export:
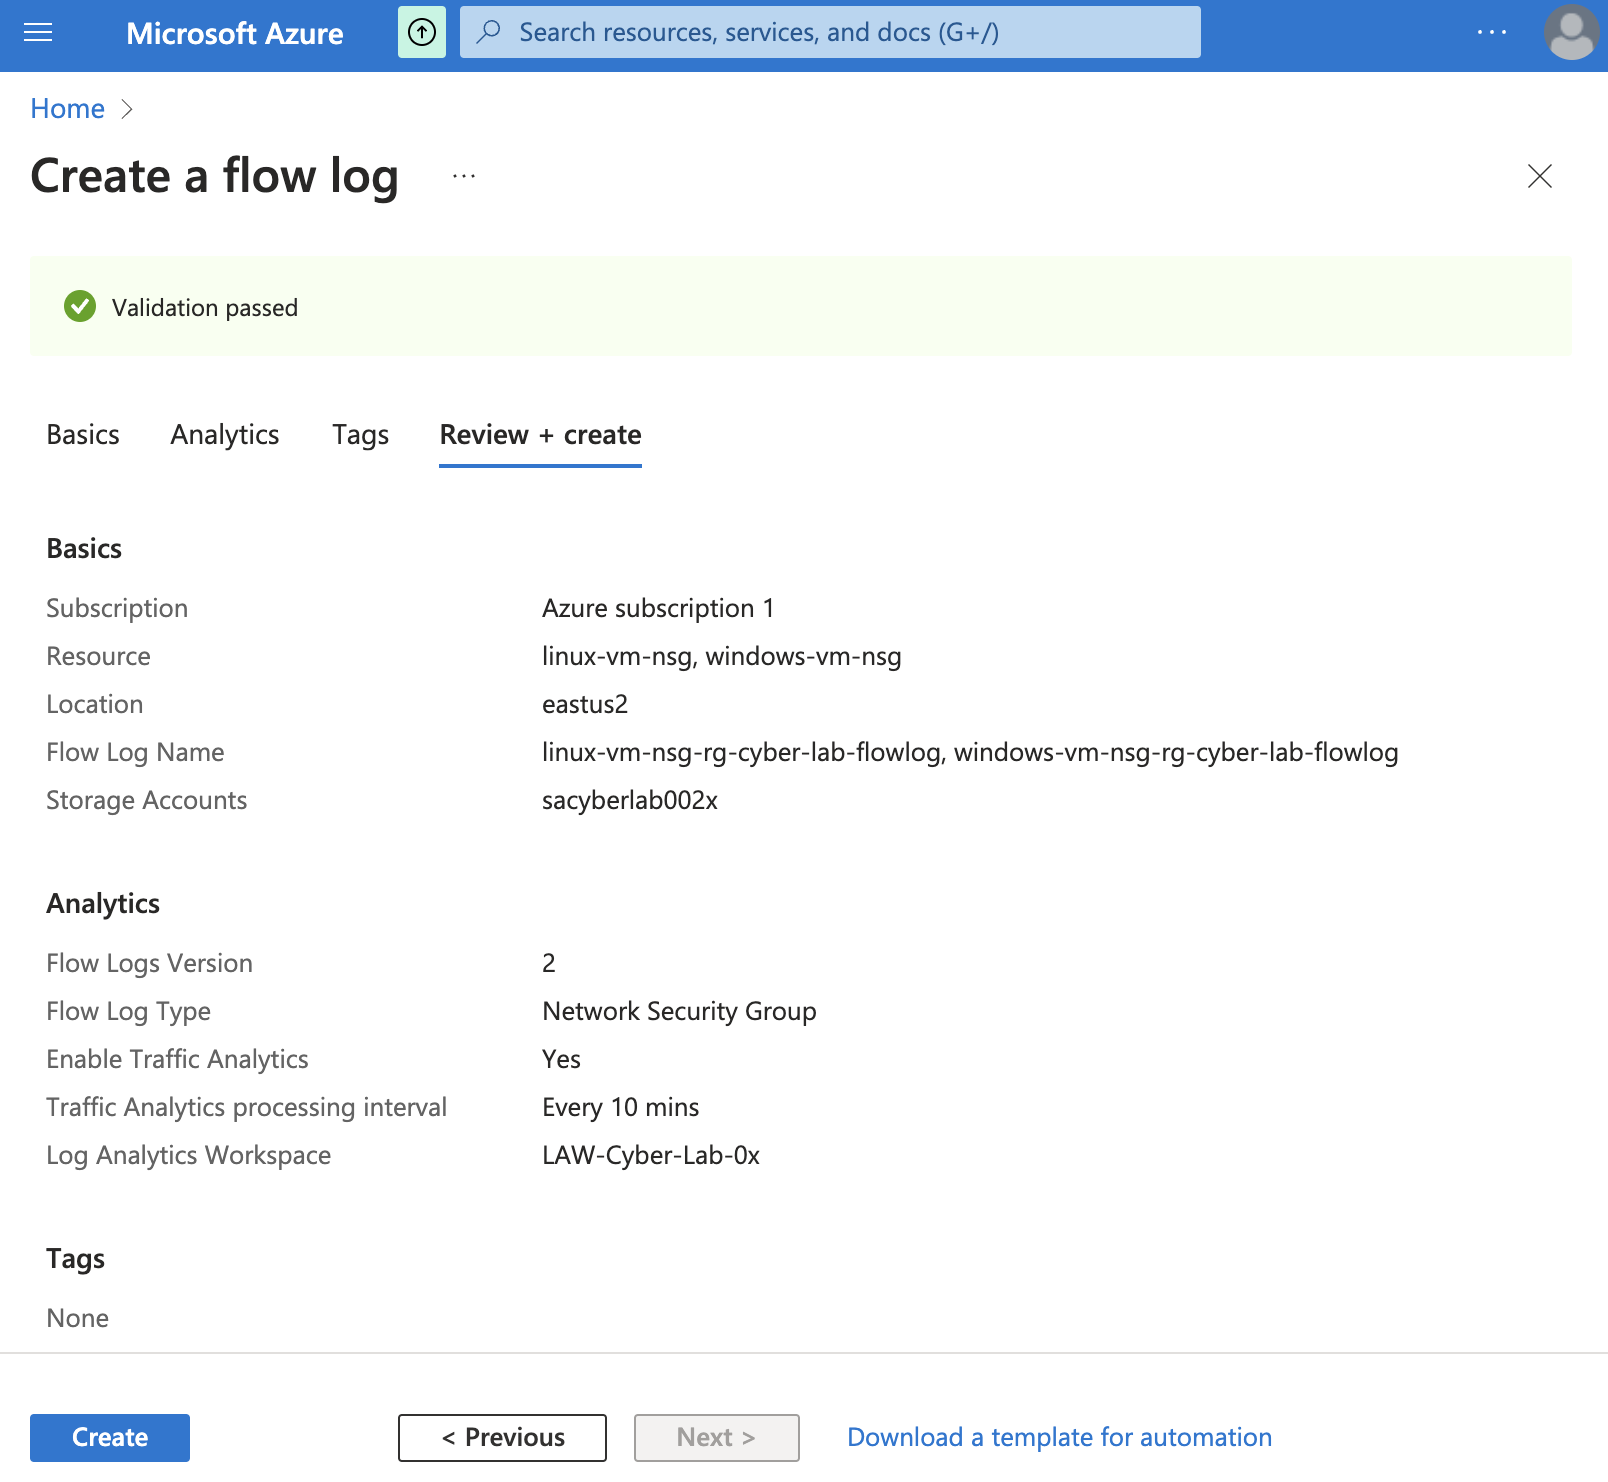
Step 3.5: Creating a flow log
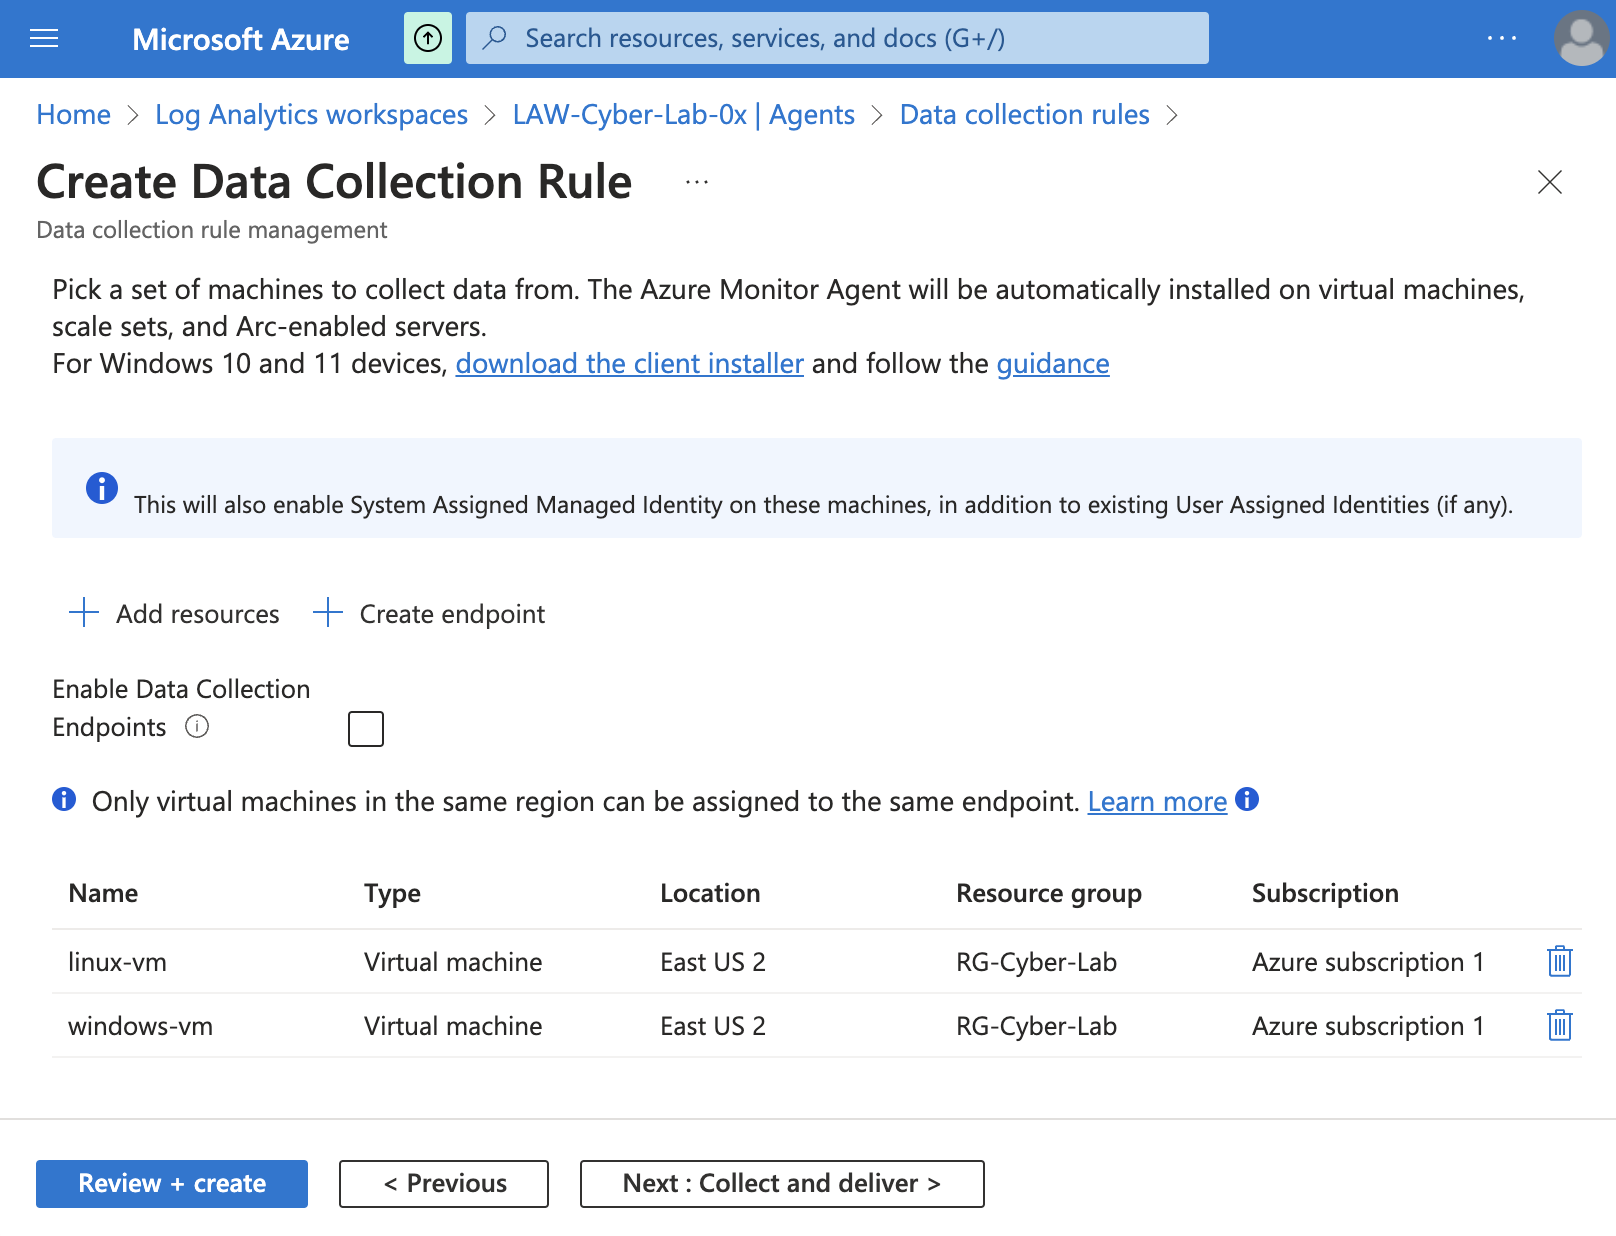
Step 3.6: Creating a data collection rule
Then, created a data collection rule, having the windows-vm and the linux-vm
as scope. For the purposes of this project, the idea was to keep track of login attempts, so for the
Windows machine, the data source type was Windows Event Logs – specifically aimed at
information, audit success, and audit failure; whereas for the Linux machine,
the data source type was Linux Syslog, under LOG_AUTH. In both cases, naturally,
the destination of this flow was set to the Law Analytics Workspace created above.
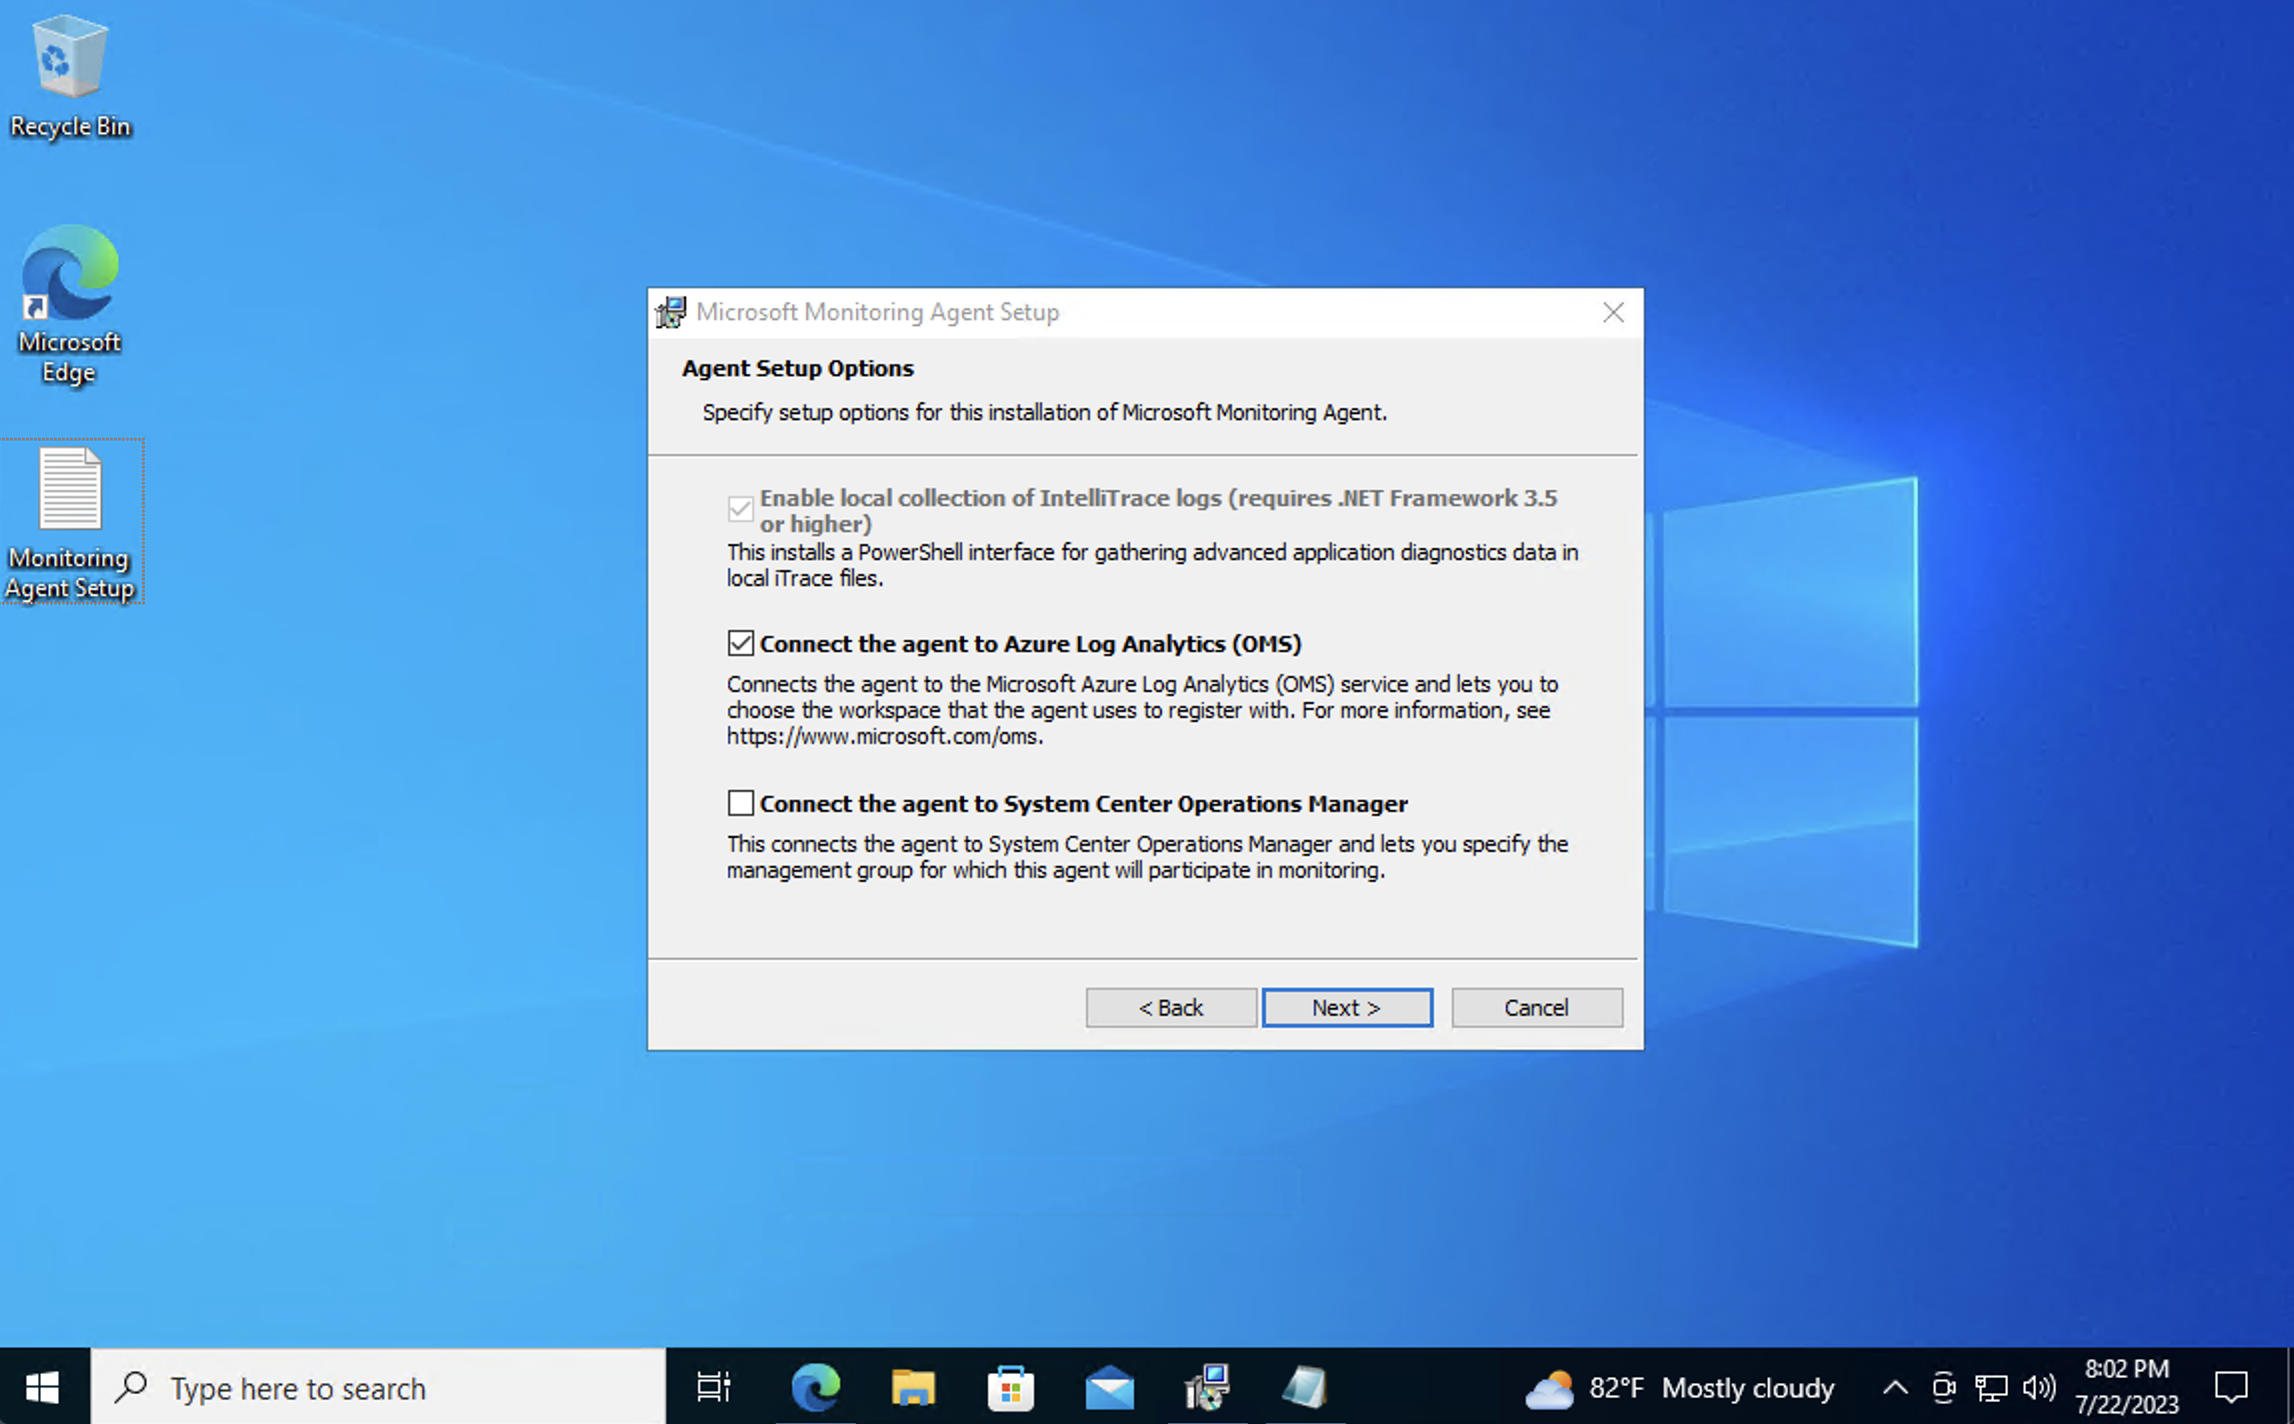
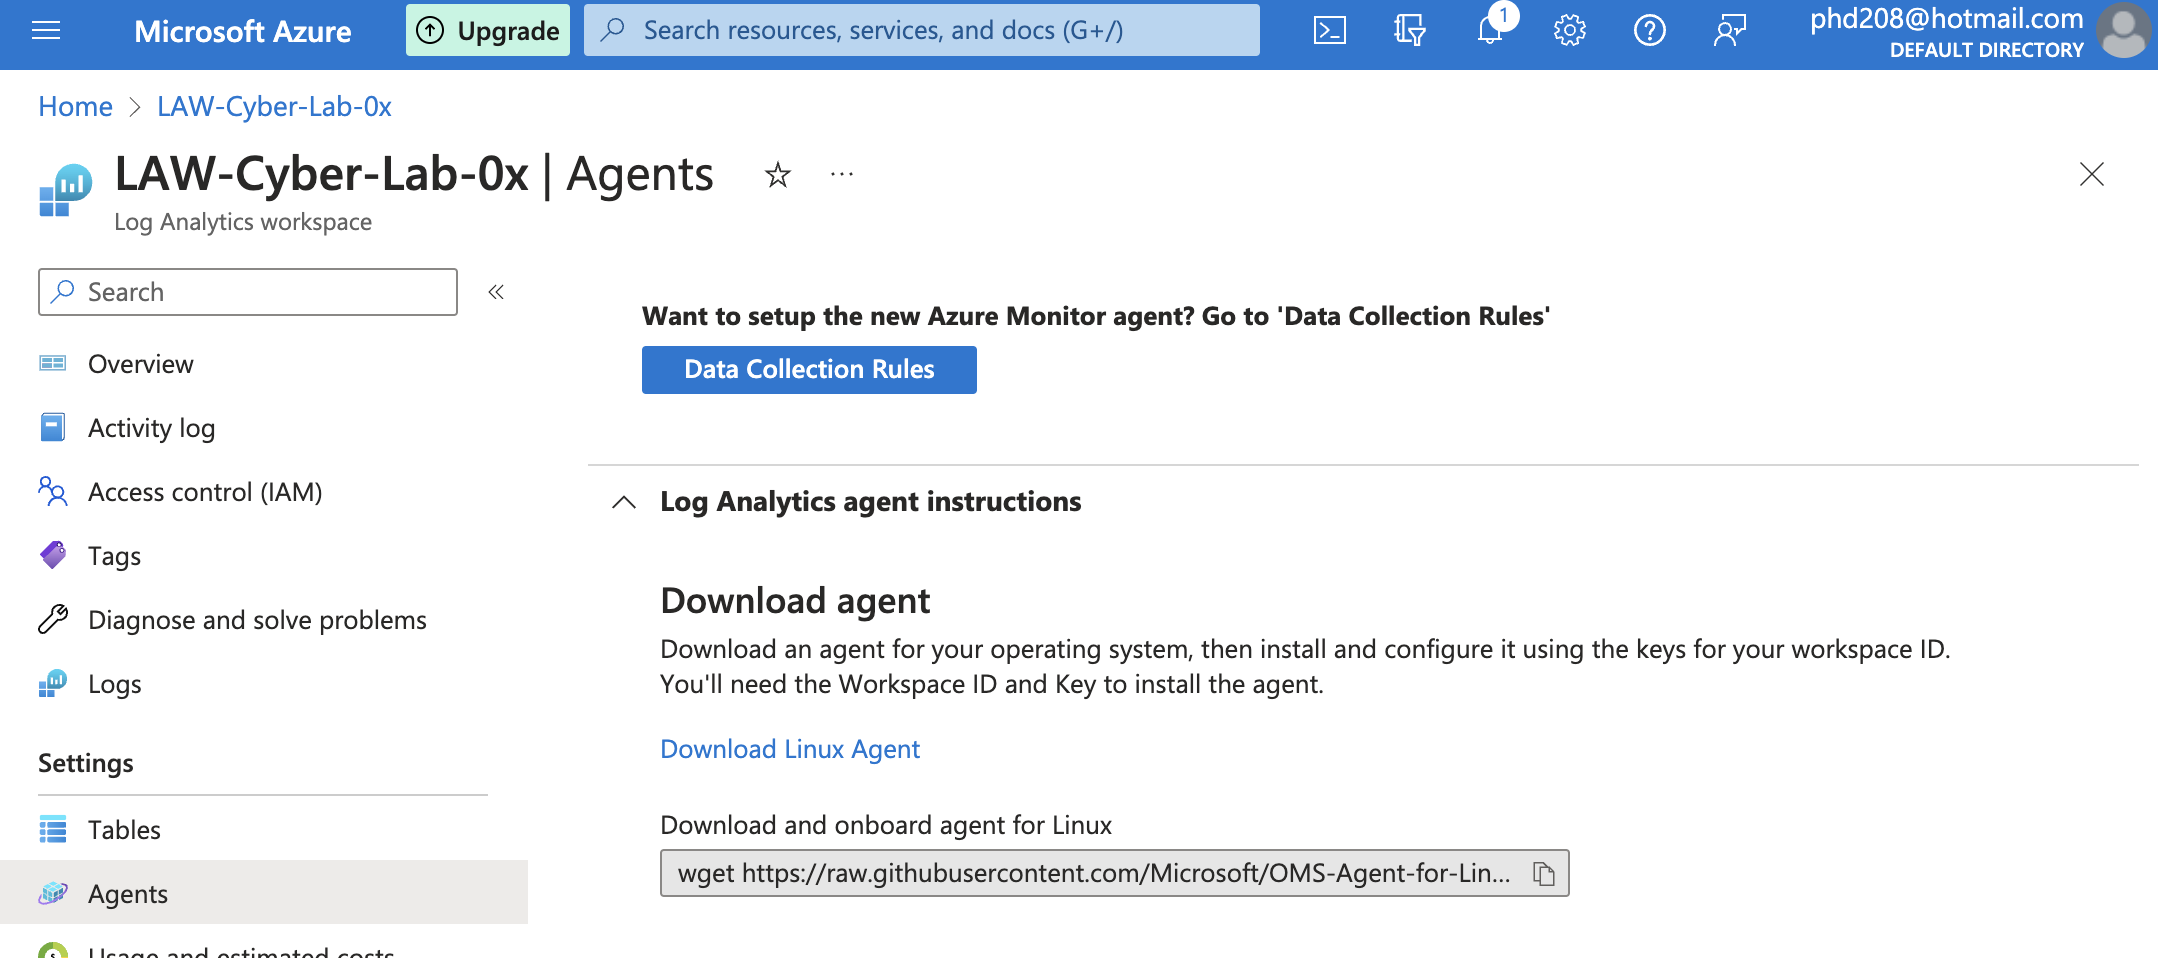
Step 3.7: Installing Log Analytics Agent in the VMs
Next, installed the Log Analytics Agent on both VMs.
In the windows-vm it is crucial to make sure that the option Connect the agent to Azure Log
Analytics is set.
In the linux-vm, the Log Analytics Agent can be easily installed via the command-line
by using the command provided by the Log Analytics Workspace:
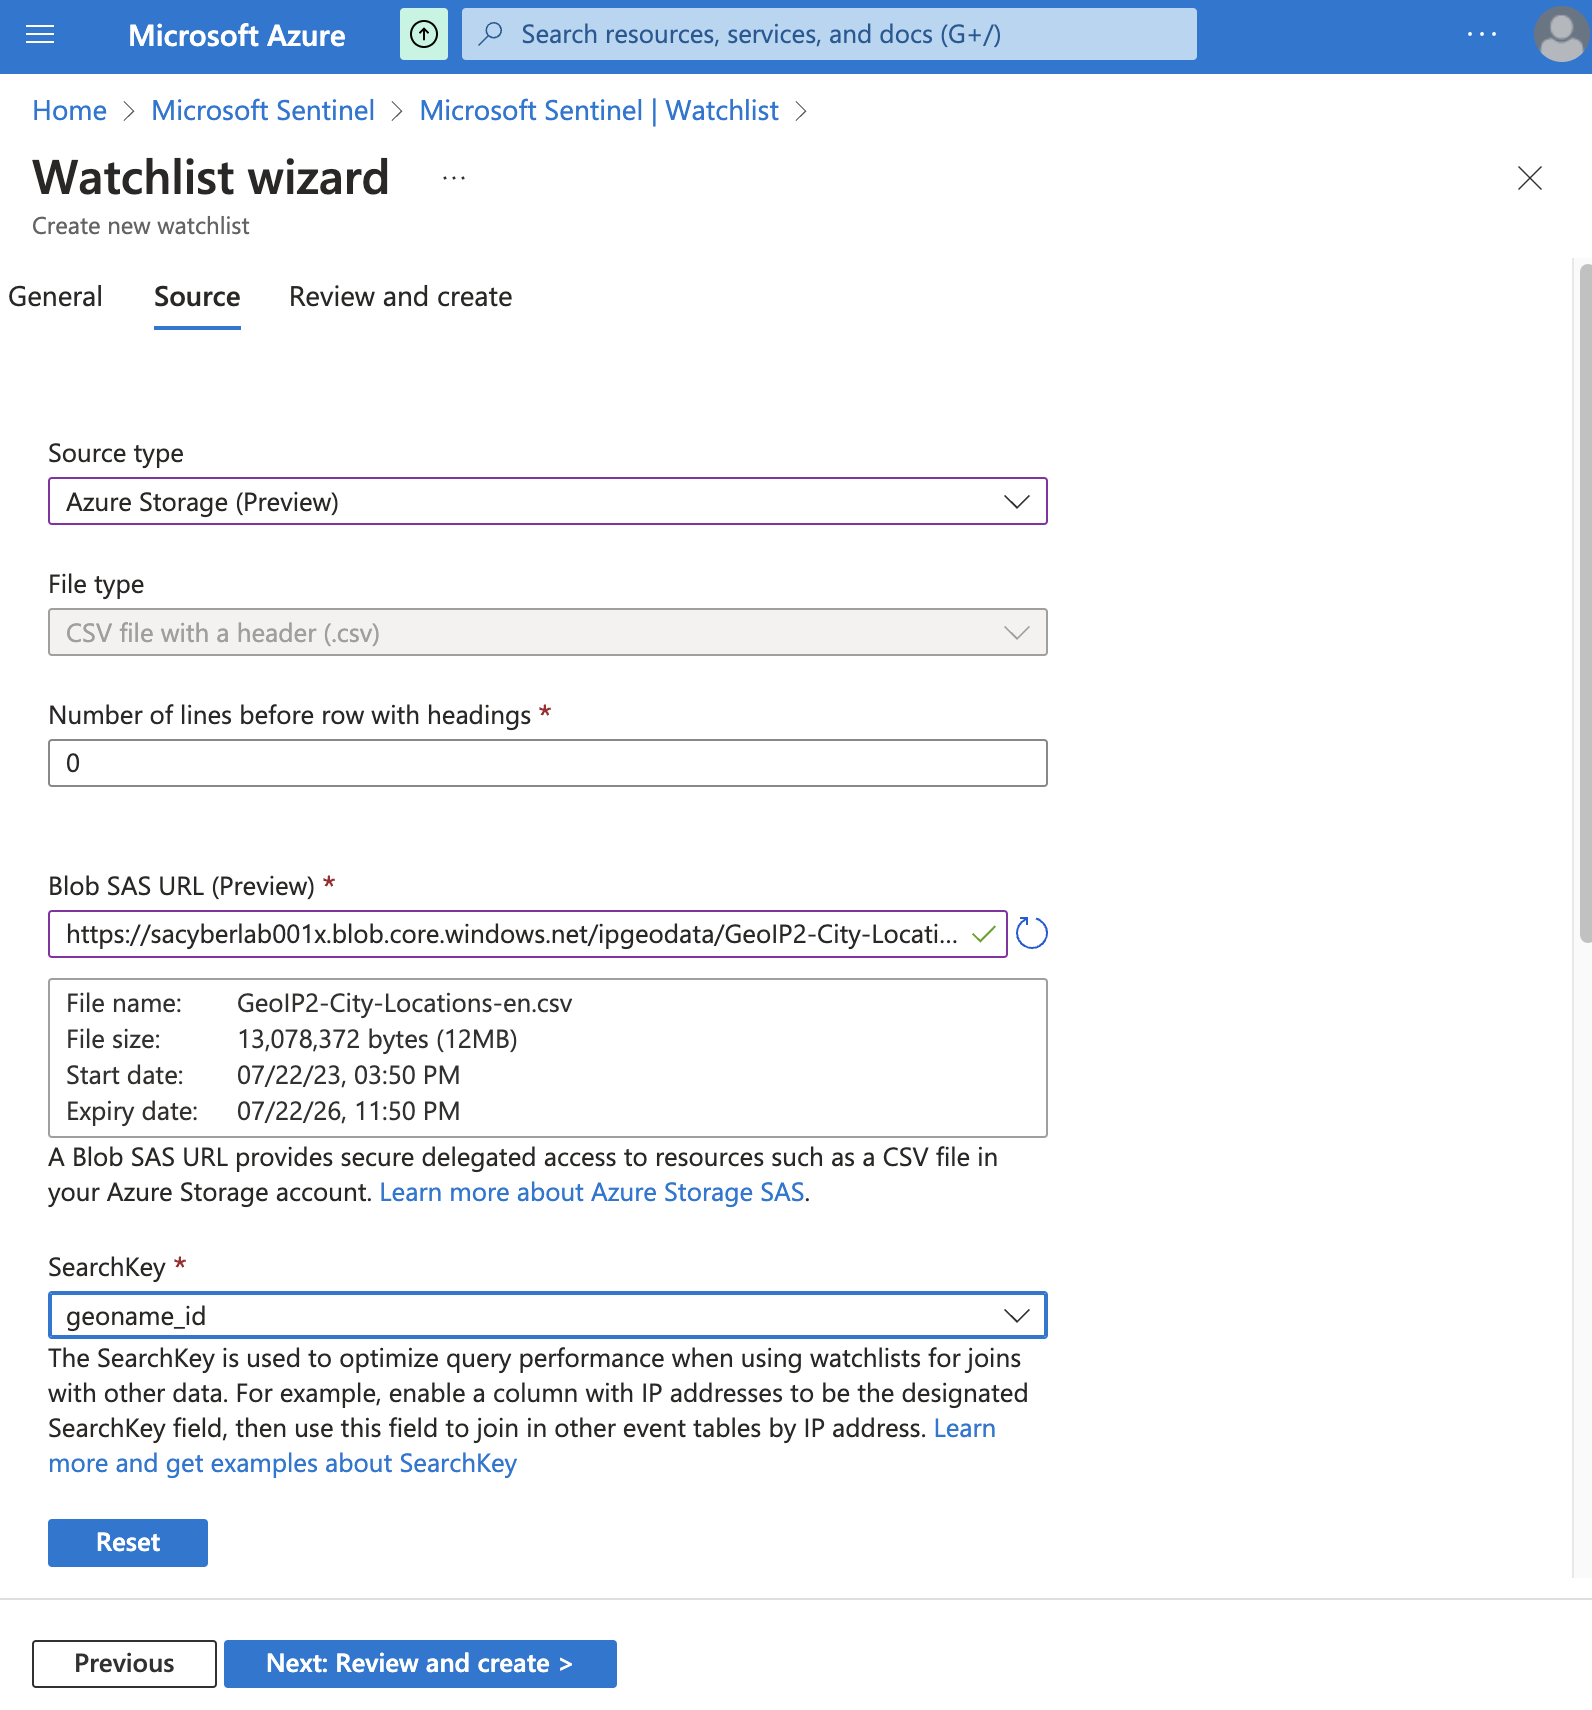
Step 3.8: Enabling Geo Data
Created a Azure Storage account within the main resource group, and within it I created a container
in whihc I uploaded to .csv files containing tentative geo data (latitute, longitude)
corresponding to IP numbers.
Then, setup Microsoft Sentinel, connected to the Log Analytics Workspace, and created Watchlists to ingest the geo-data from the csv files. This information will later allow for the creation of the attack maps.
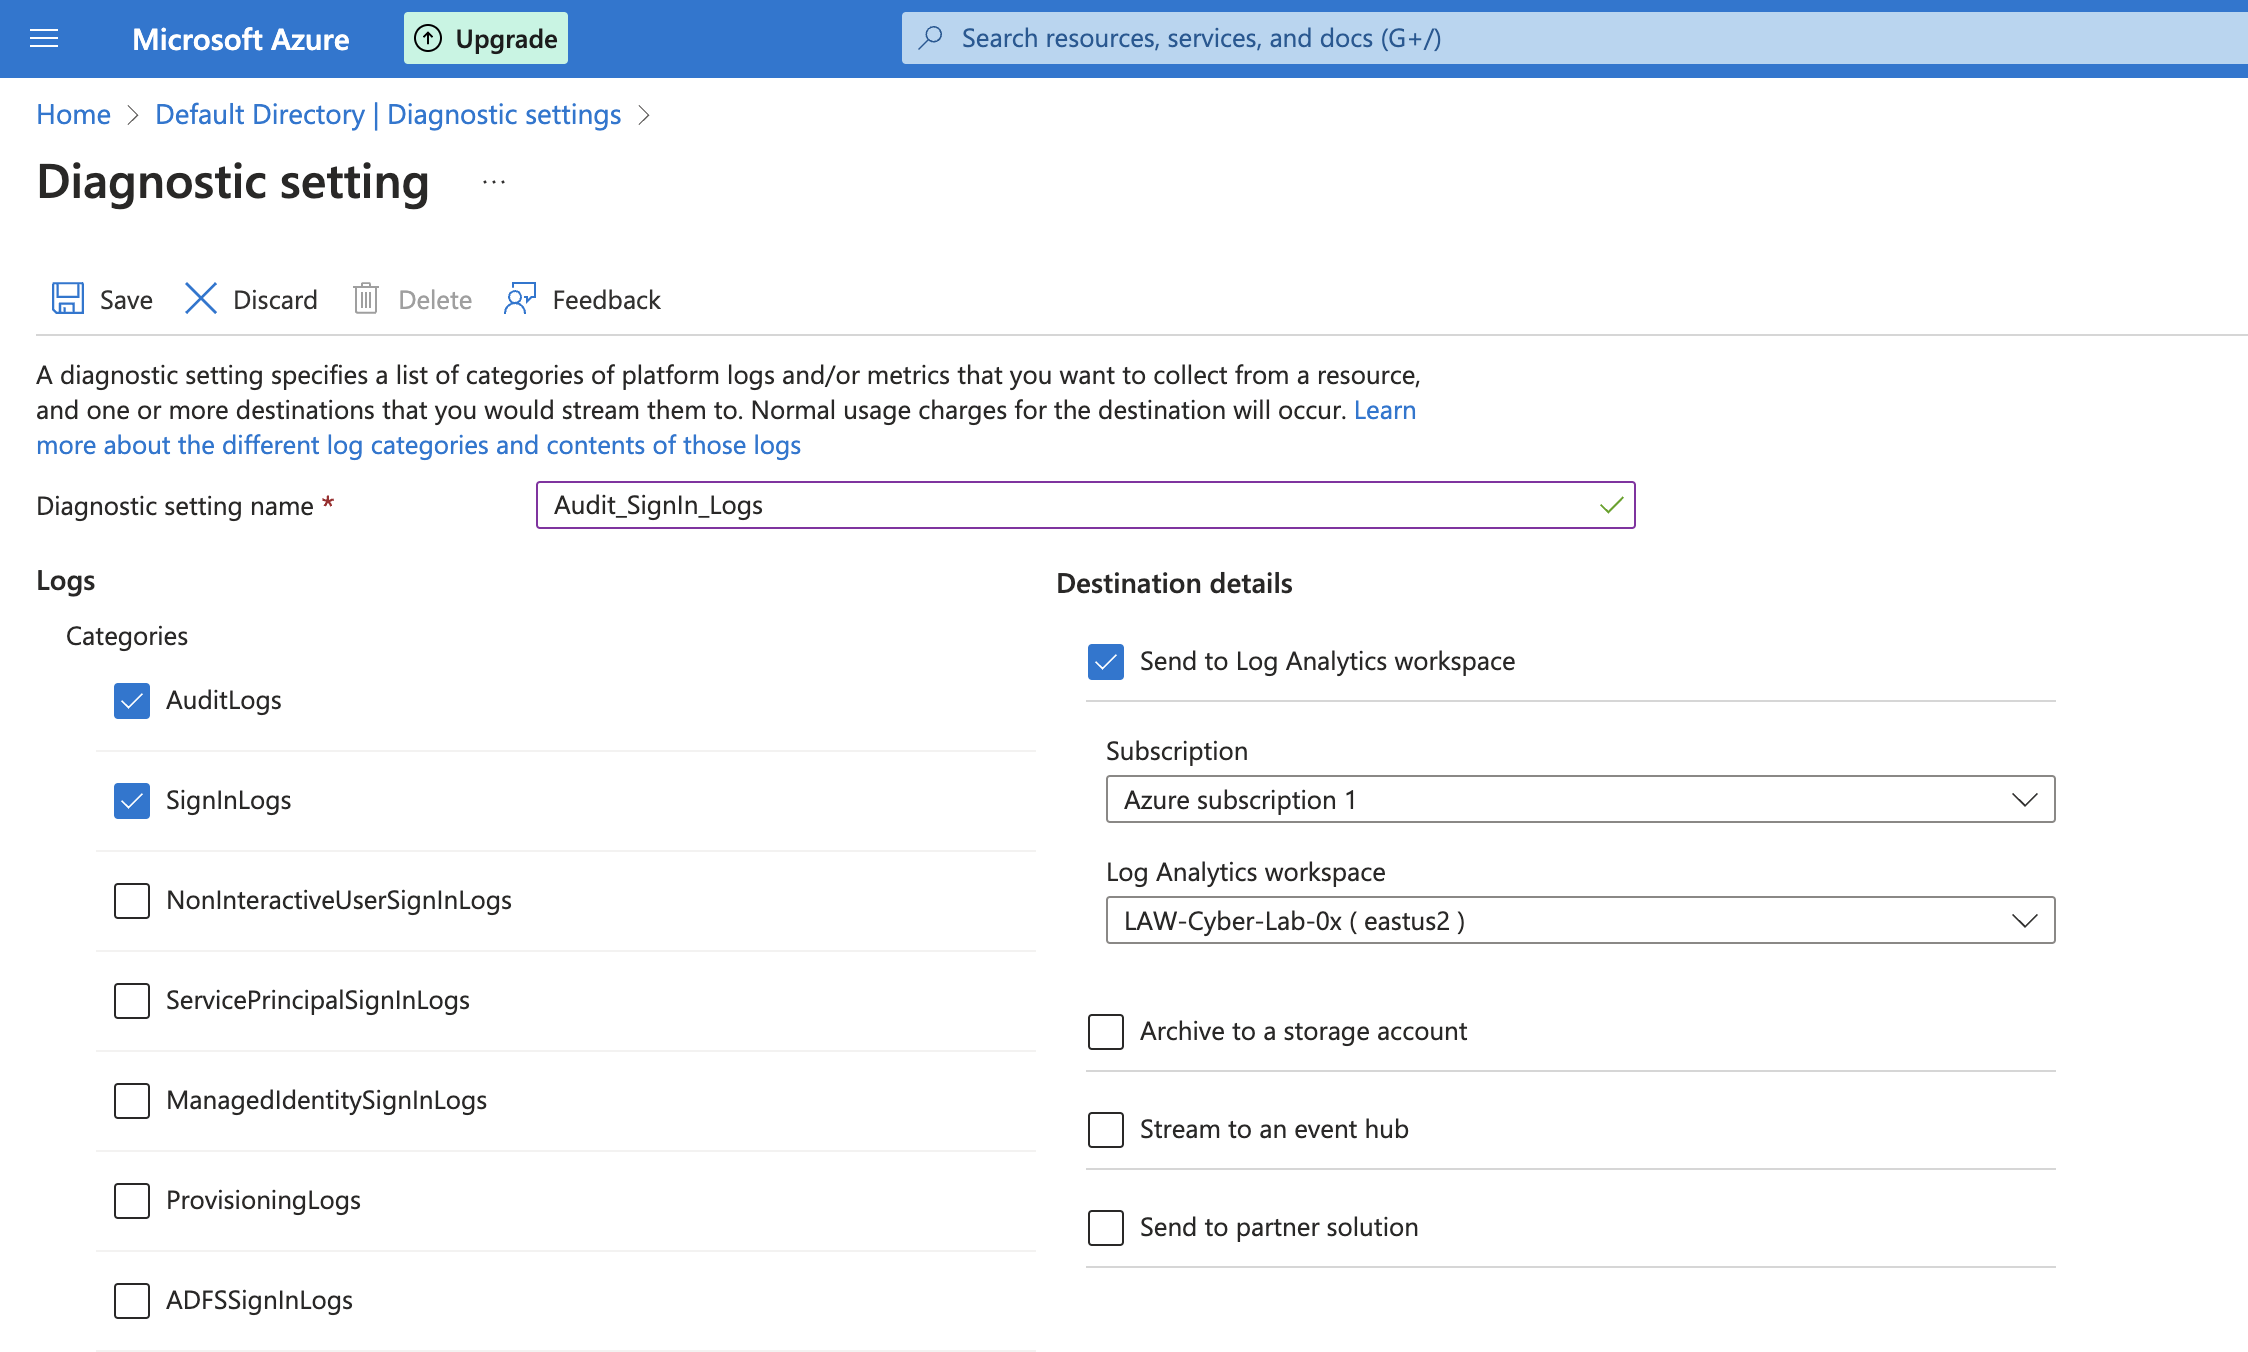
Step 4: Configuring logging at tenant, subscription and resource levels
This section entailed the creation of diagnostic settings to ingest Azure AD Logs –
AuditLogs, SignInLogs and send them to Log Analytics Workspace,
where they would be used by Microsoft Sentinel.
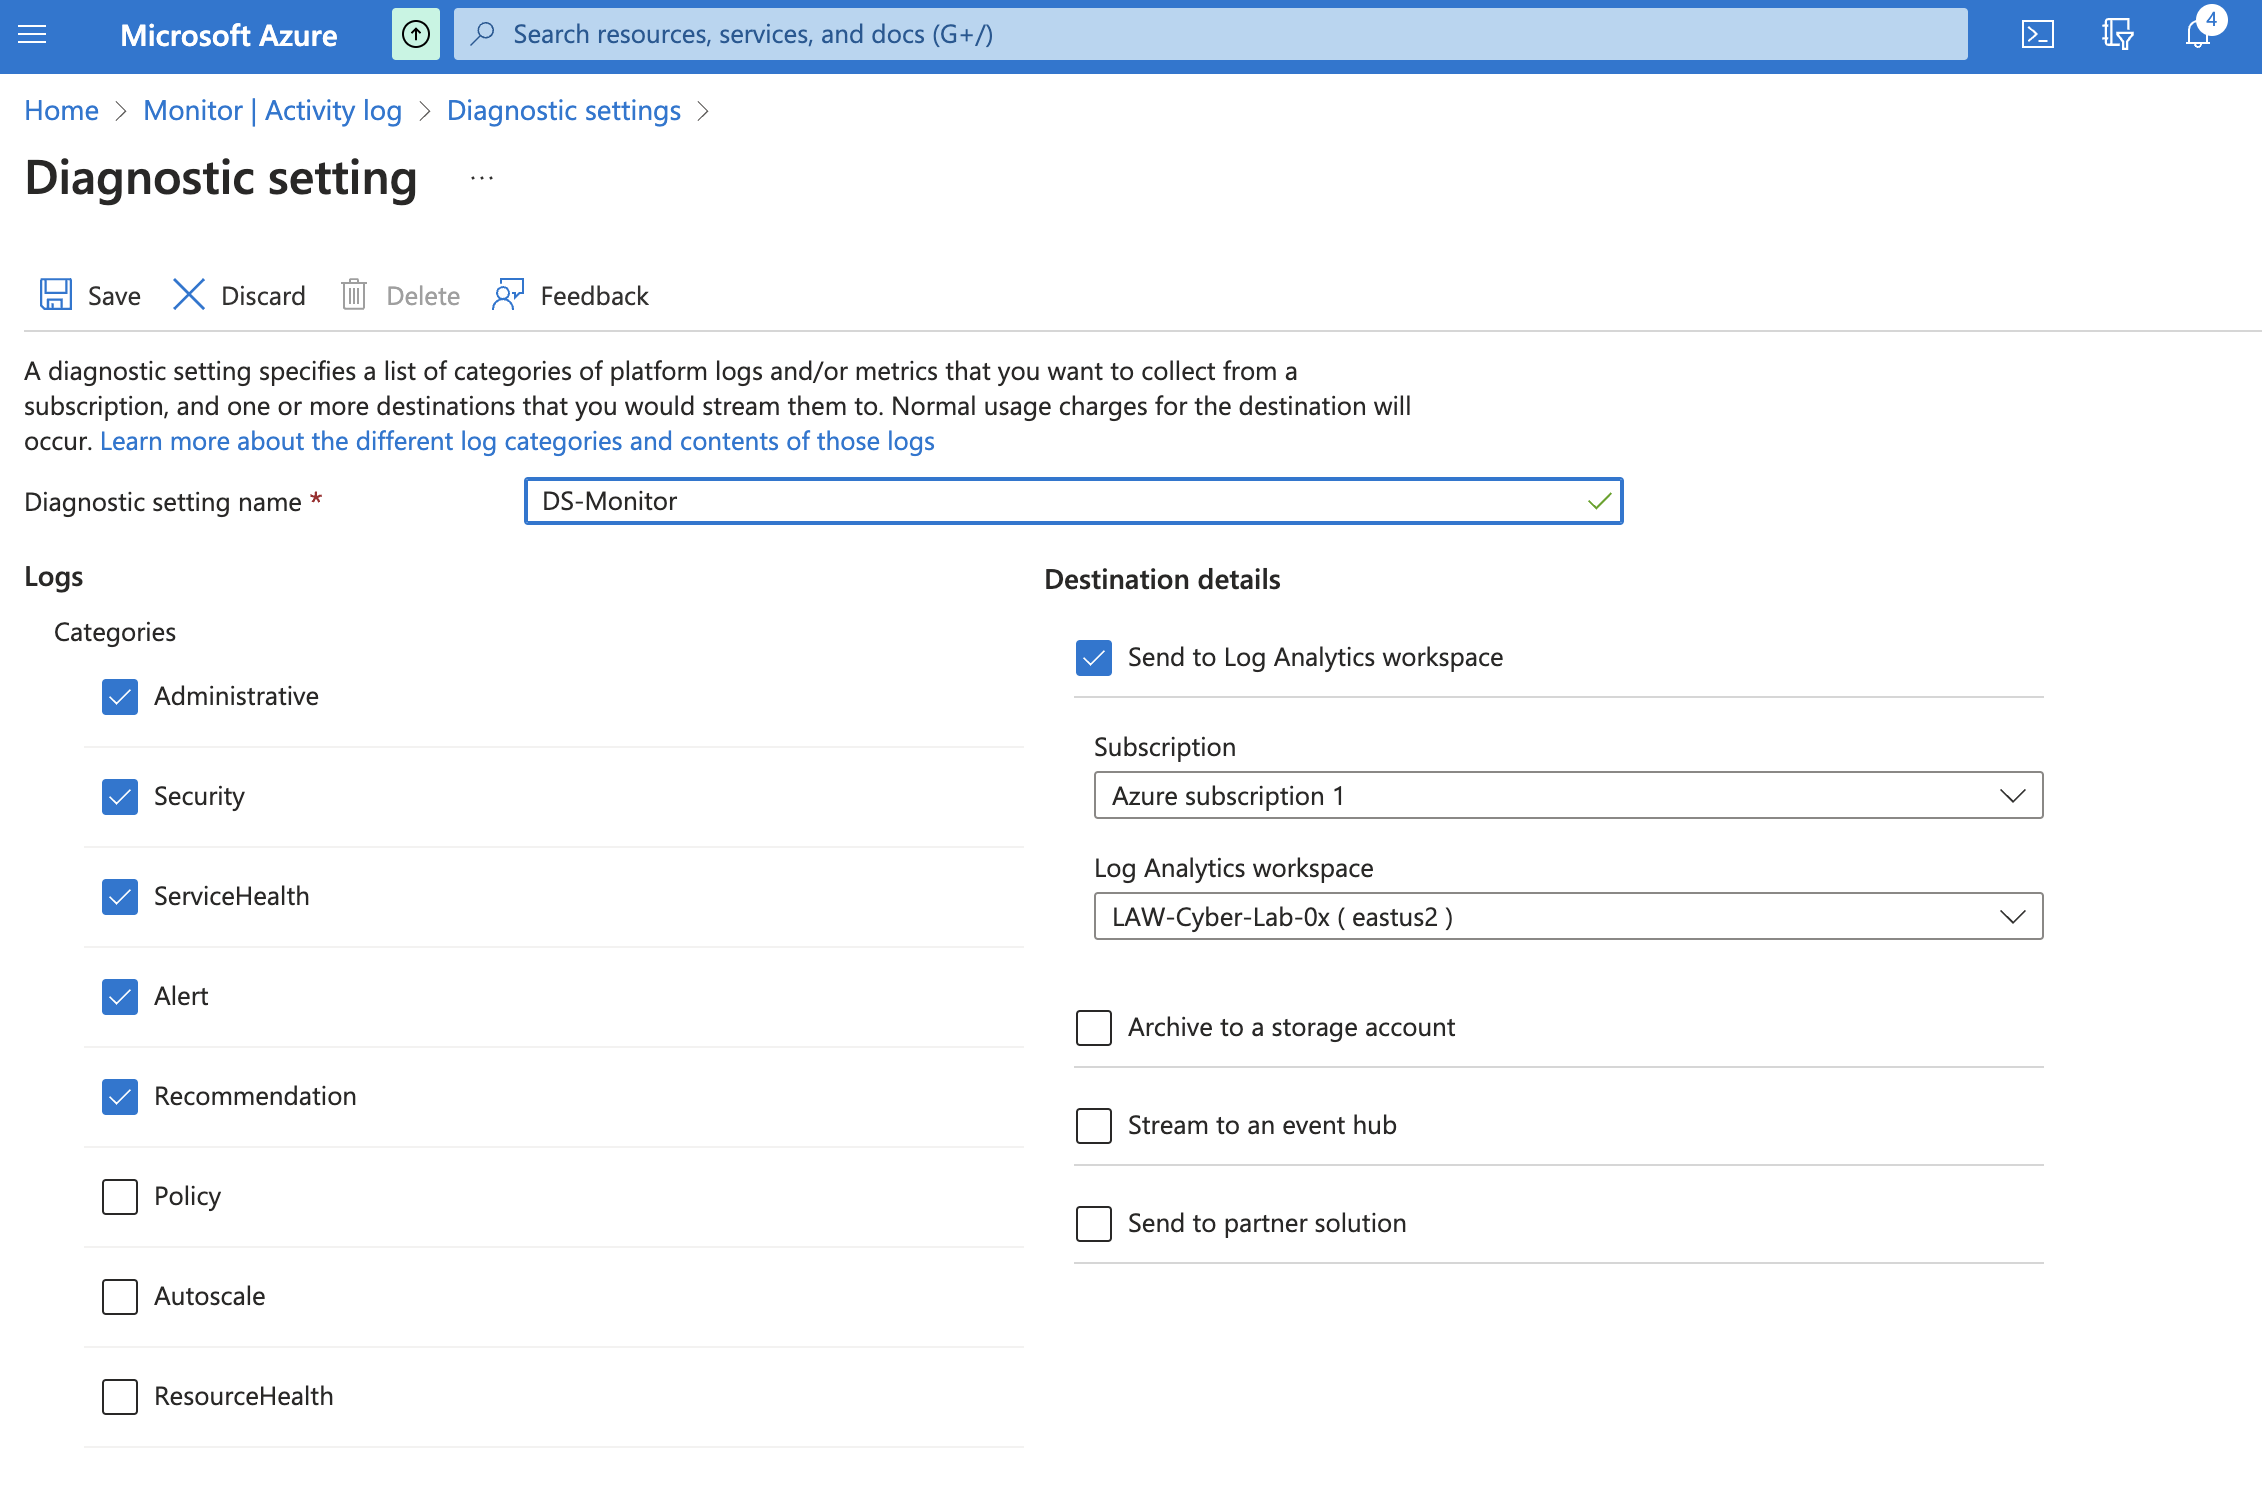
Conversely, same was done at subscription level:
And then at resource level, for the storage:
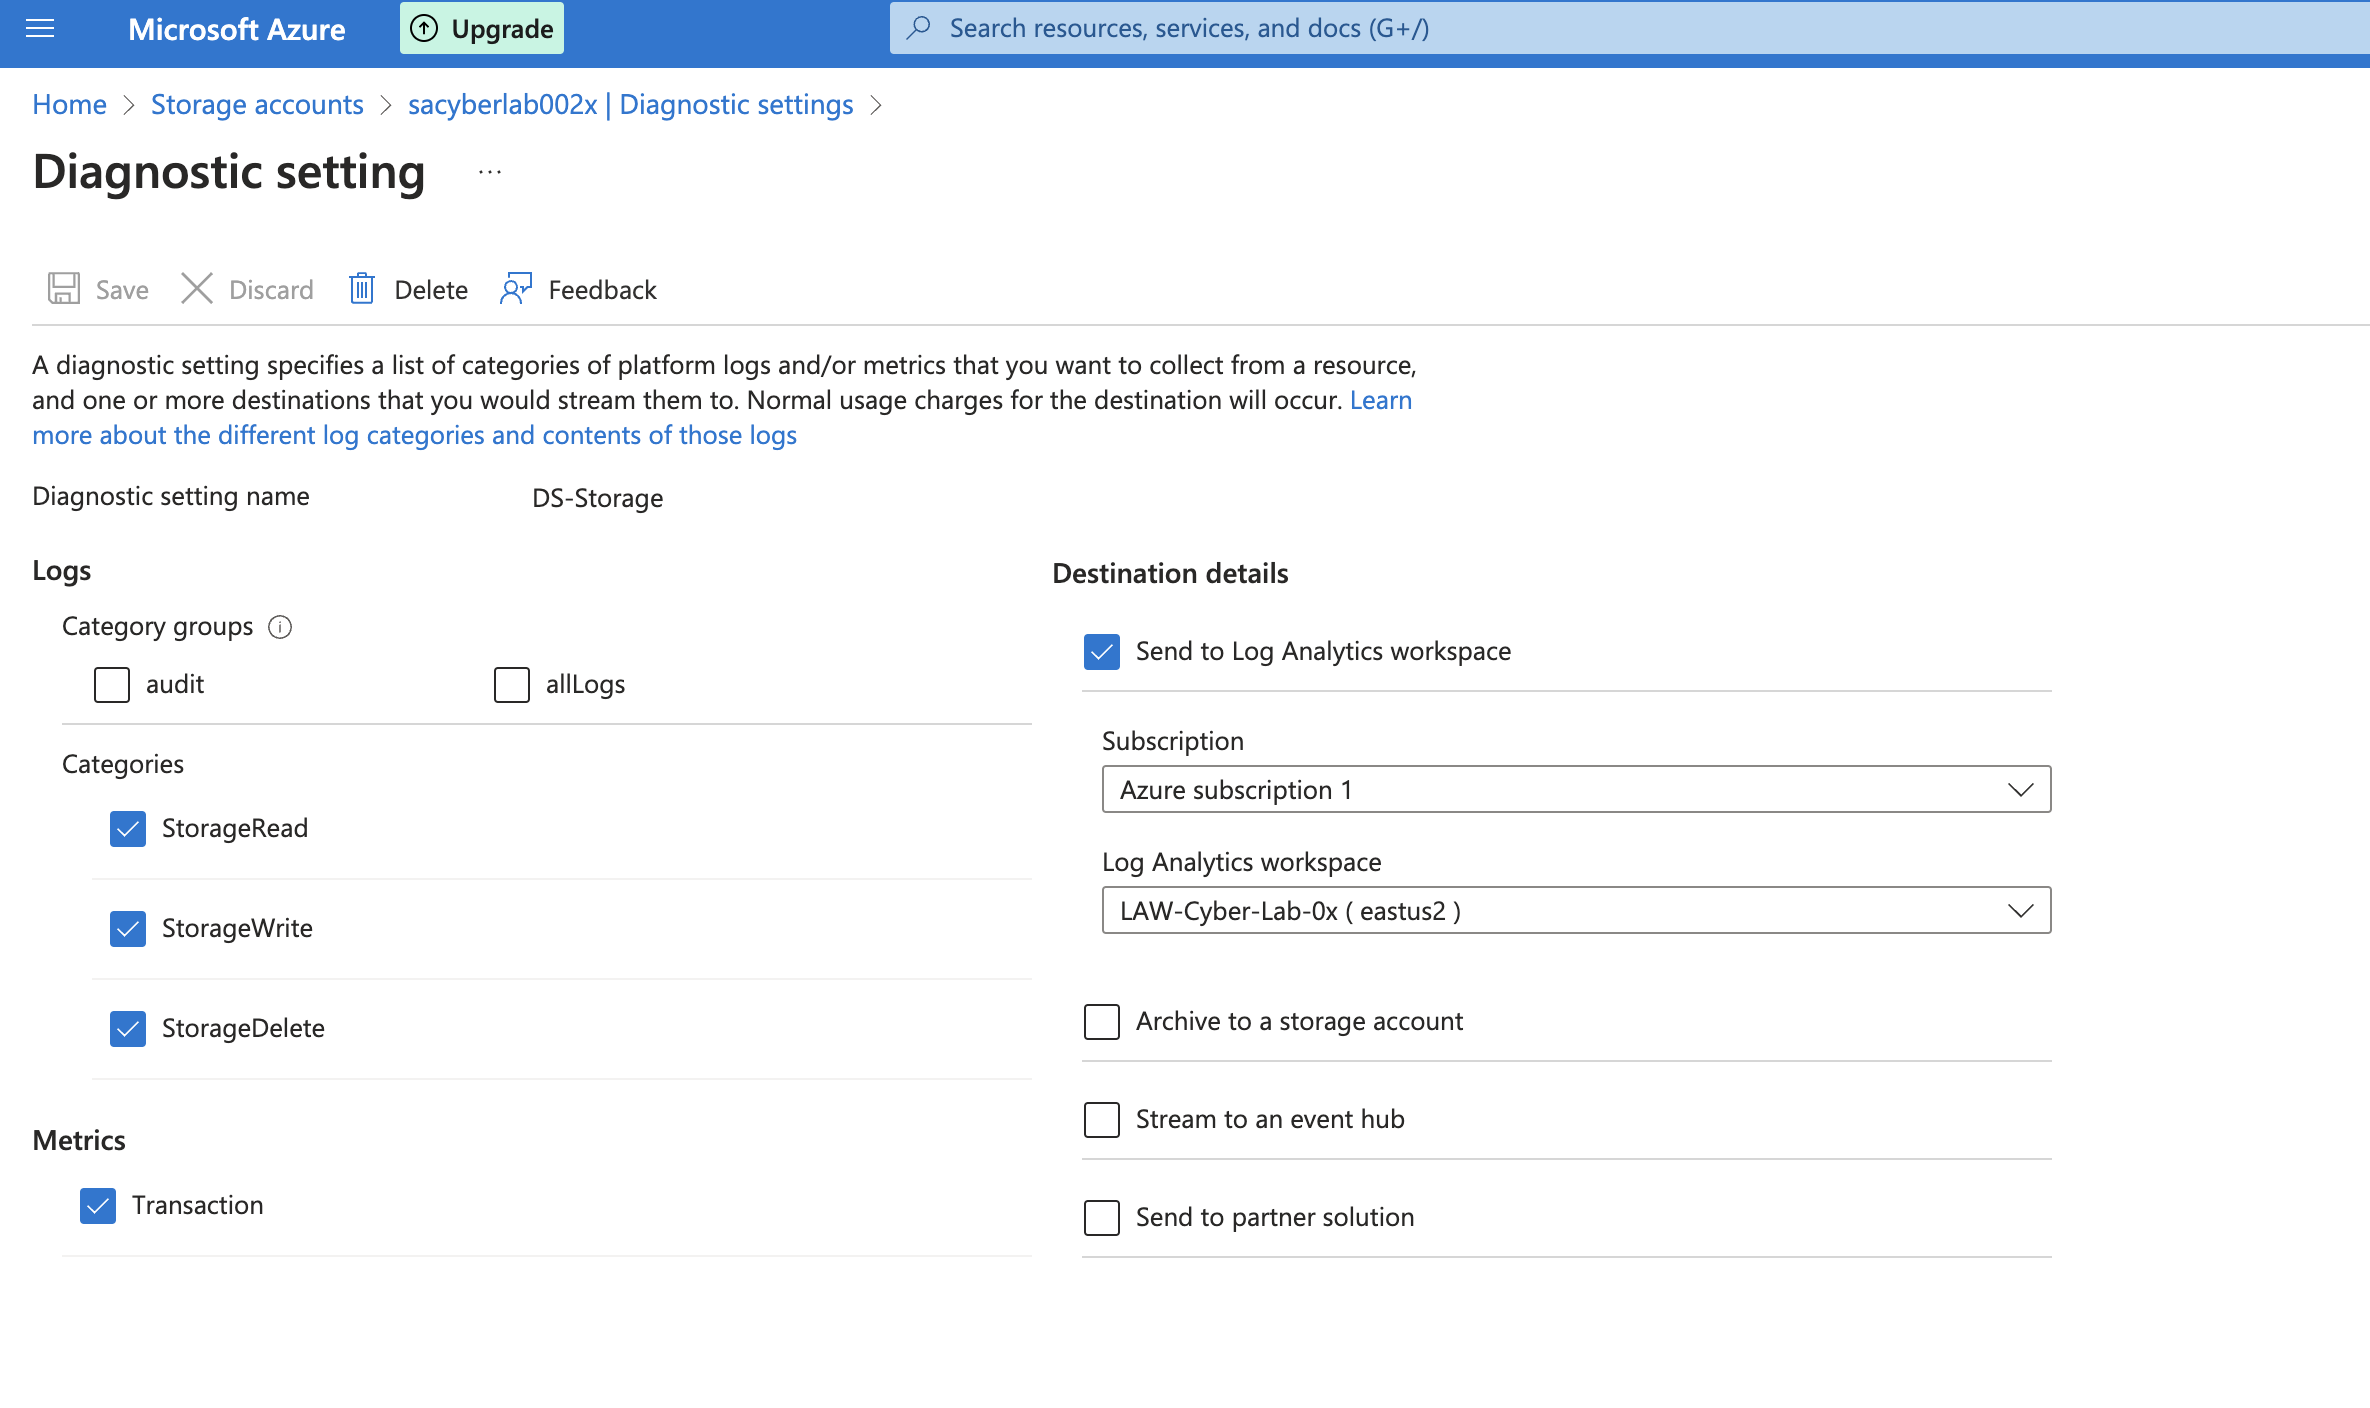
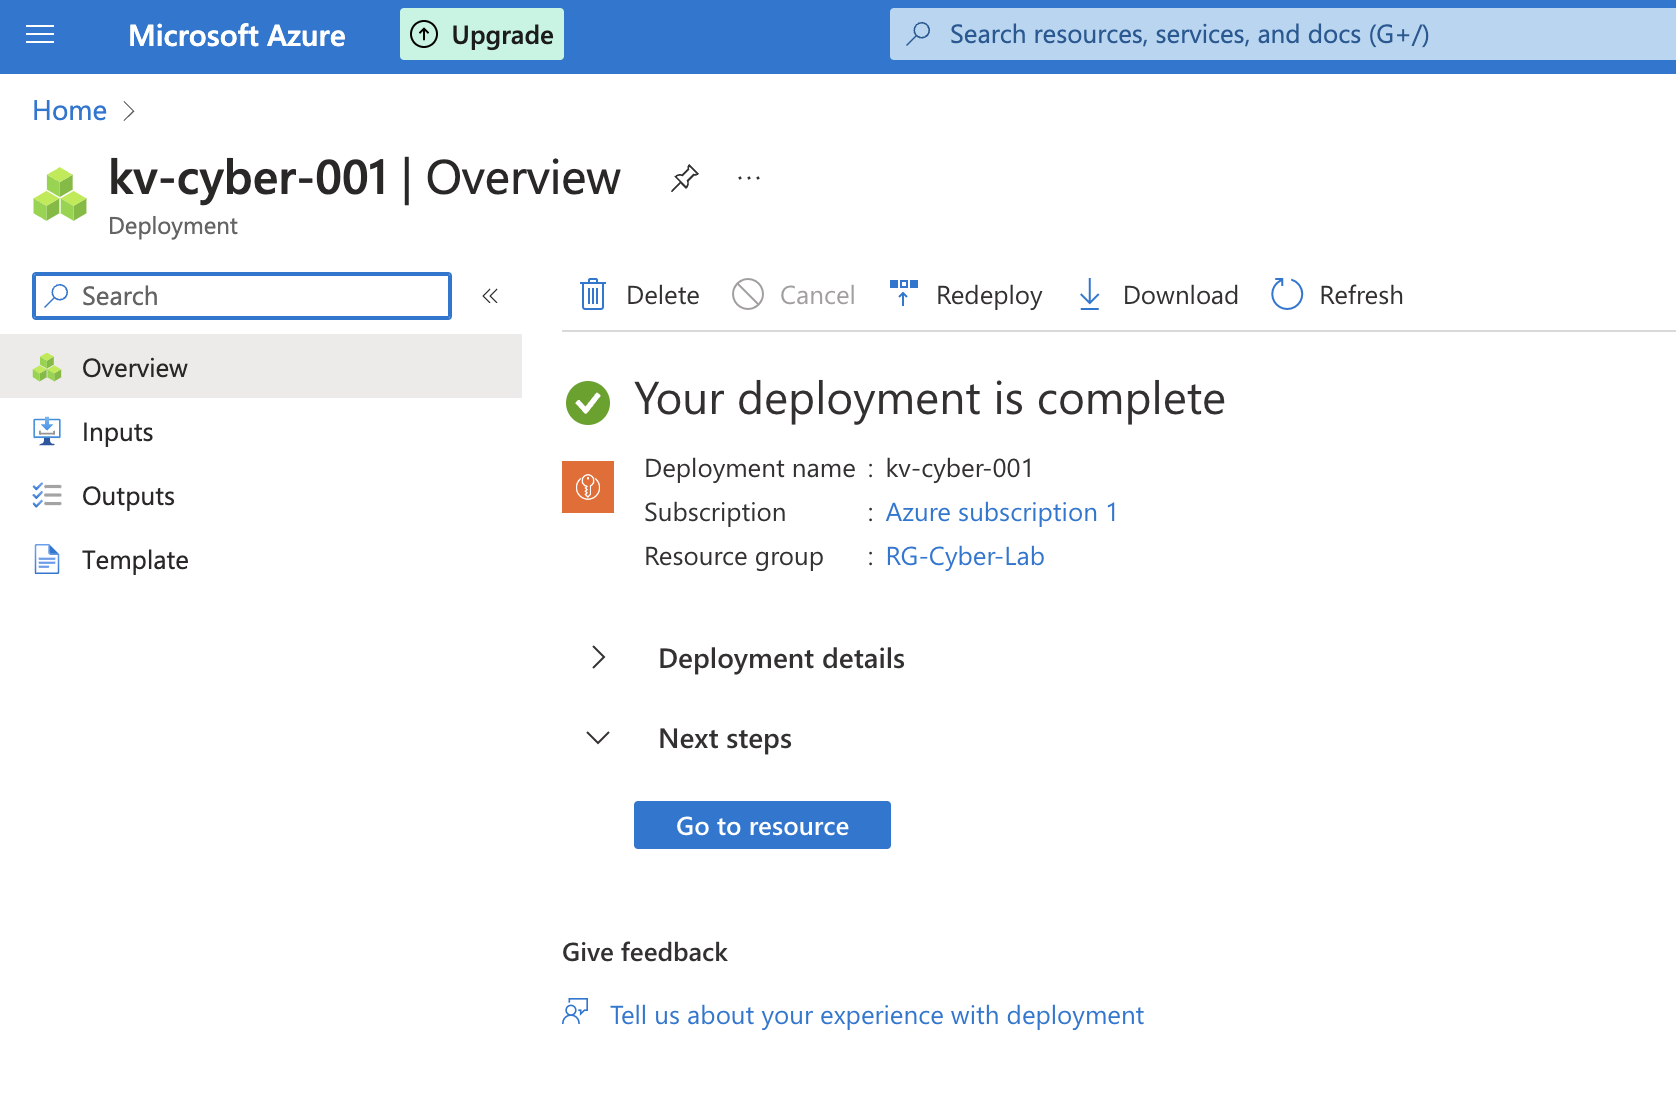
And for the key vault:
Step 5: Preparing attack maps
Using pre-built JSON maps, I created four different workbooks in Sentinel in order to show different types of malicious traffic from around the world targeting my resources, namely:
- Windows RDP/SMB authentication failures
- Linux SSH authentication failures
- MS SQL Server authentication failures
- NSG allowed mallicious inbound flows
Before hardening security controls
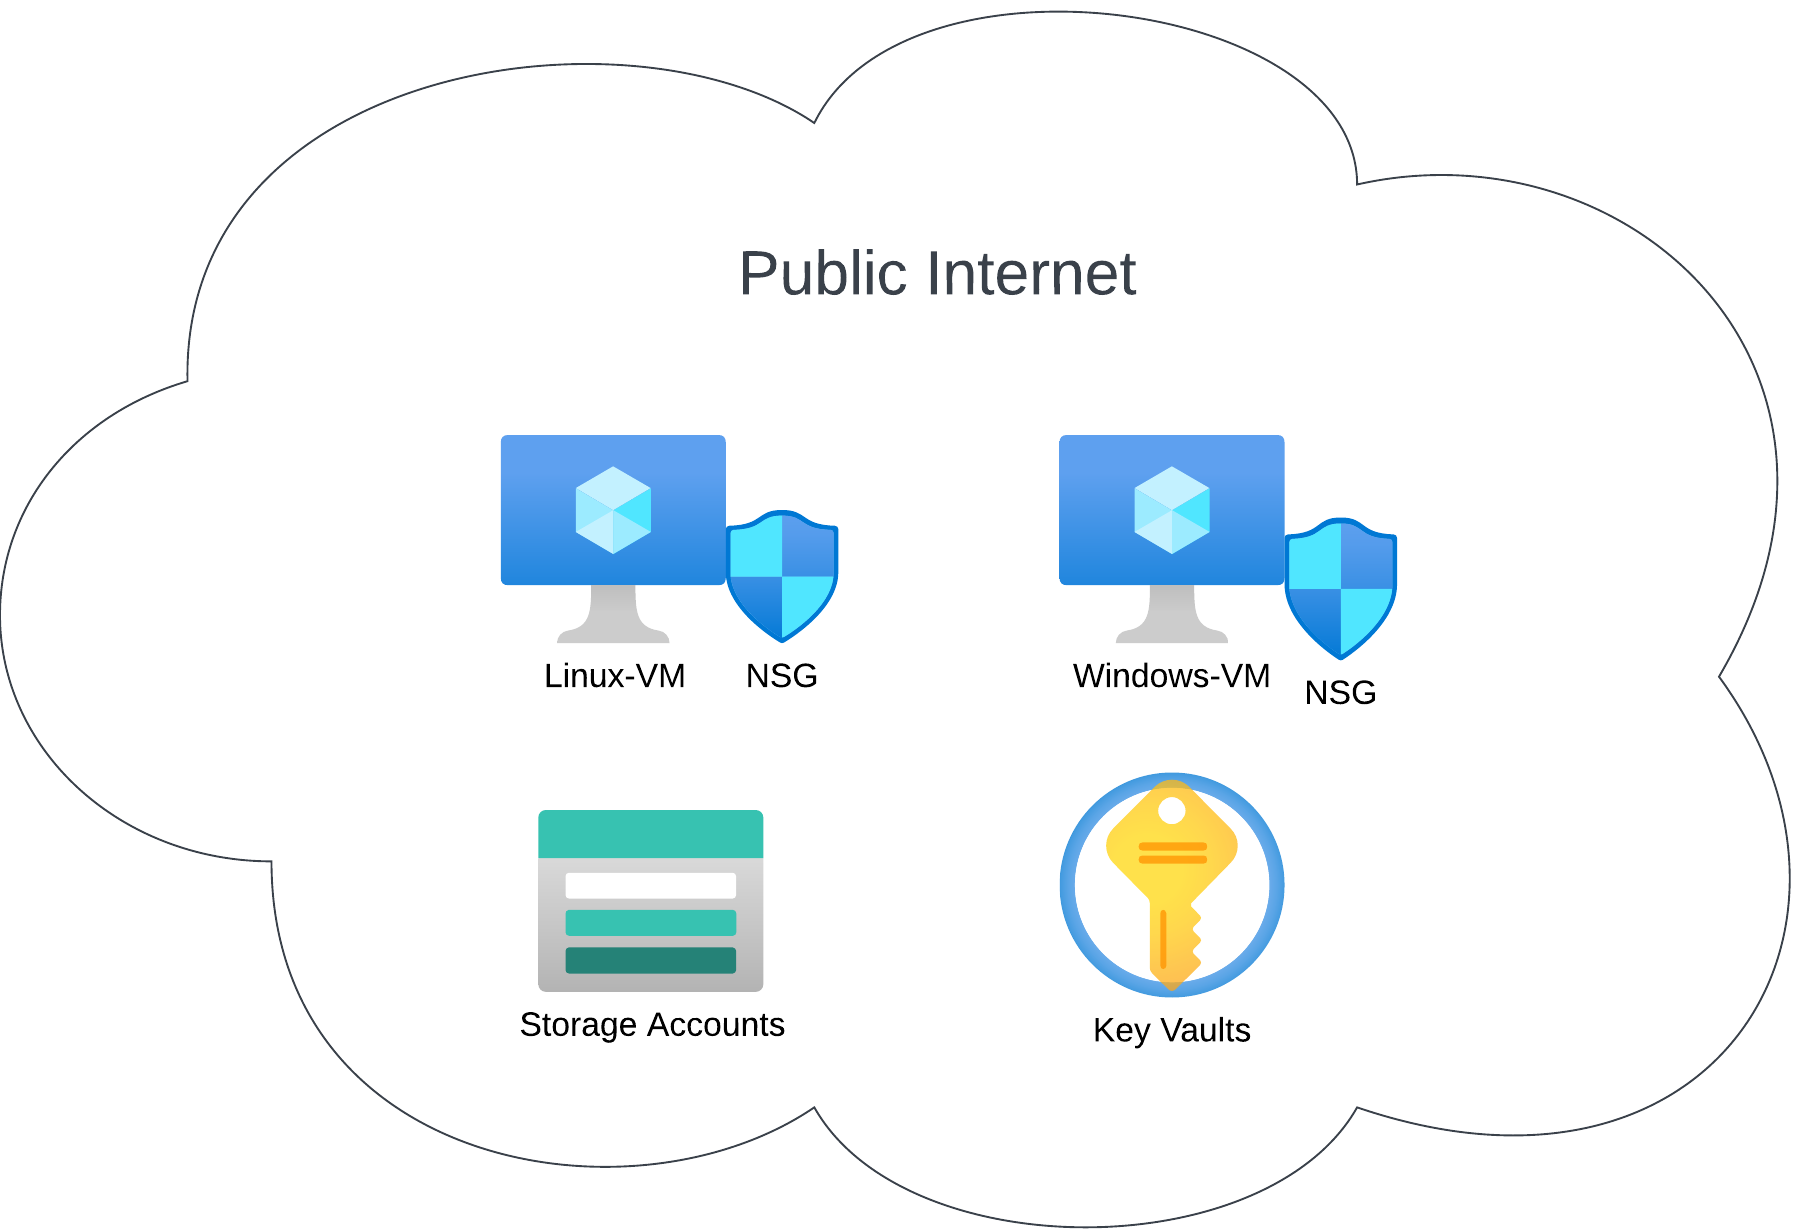
Overview
As laid out above, for the before metrics, all resources were originally deployed and exposed to the internet. The Virtual Machines had both their Network Security Groups and built-in firewalls wide open, and all other resources are deployed with public endpoints visible to the Internet – meaning, no use for Private Endpoints.
Metrics before hardening
While setting up this insecure environment, the Log Analytics workspace was configured to ingest logs from inbound live traffic and then feed it to Microsoft Sentinel which would in turn, generate attack maps, trigger alerts and create incidents.
Once that structure was in place, I set a 24-hour interval – from 20:34:47 on 2023-08-05 till the exact same time on 2023-08-06. The table below reveals the overall stats of the identified security events:
| Metric | Count |
|---|---|
| Security events (Windows-VMs) | 92 999 |
| Syslog (Linux-VMs) | 3 741 |
| Security Alert (MS Defender for Cloud) | 7 |
| Security Incident (Sentinel) | 452 |
| NSG Inbound malcious flows allowed | 4 807 |
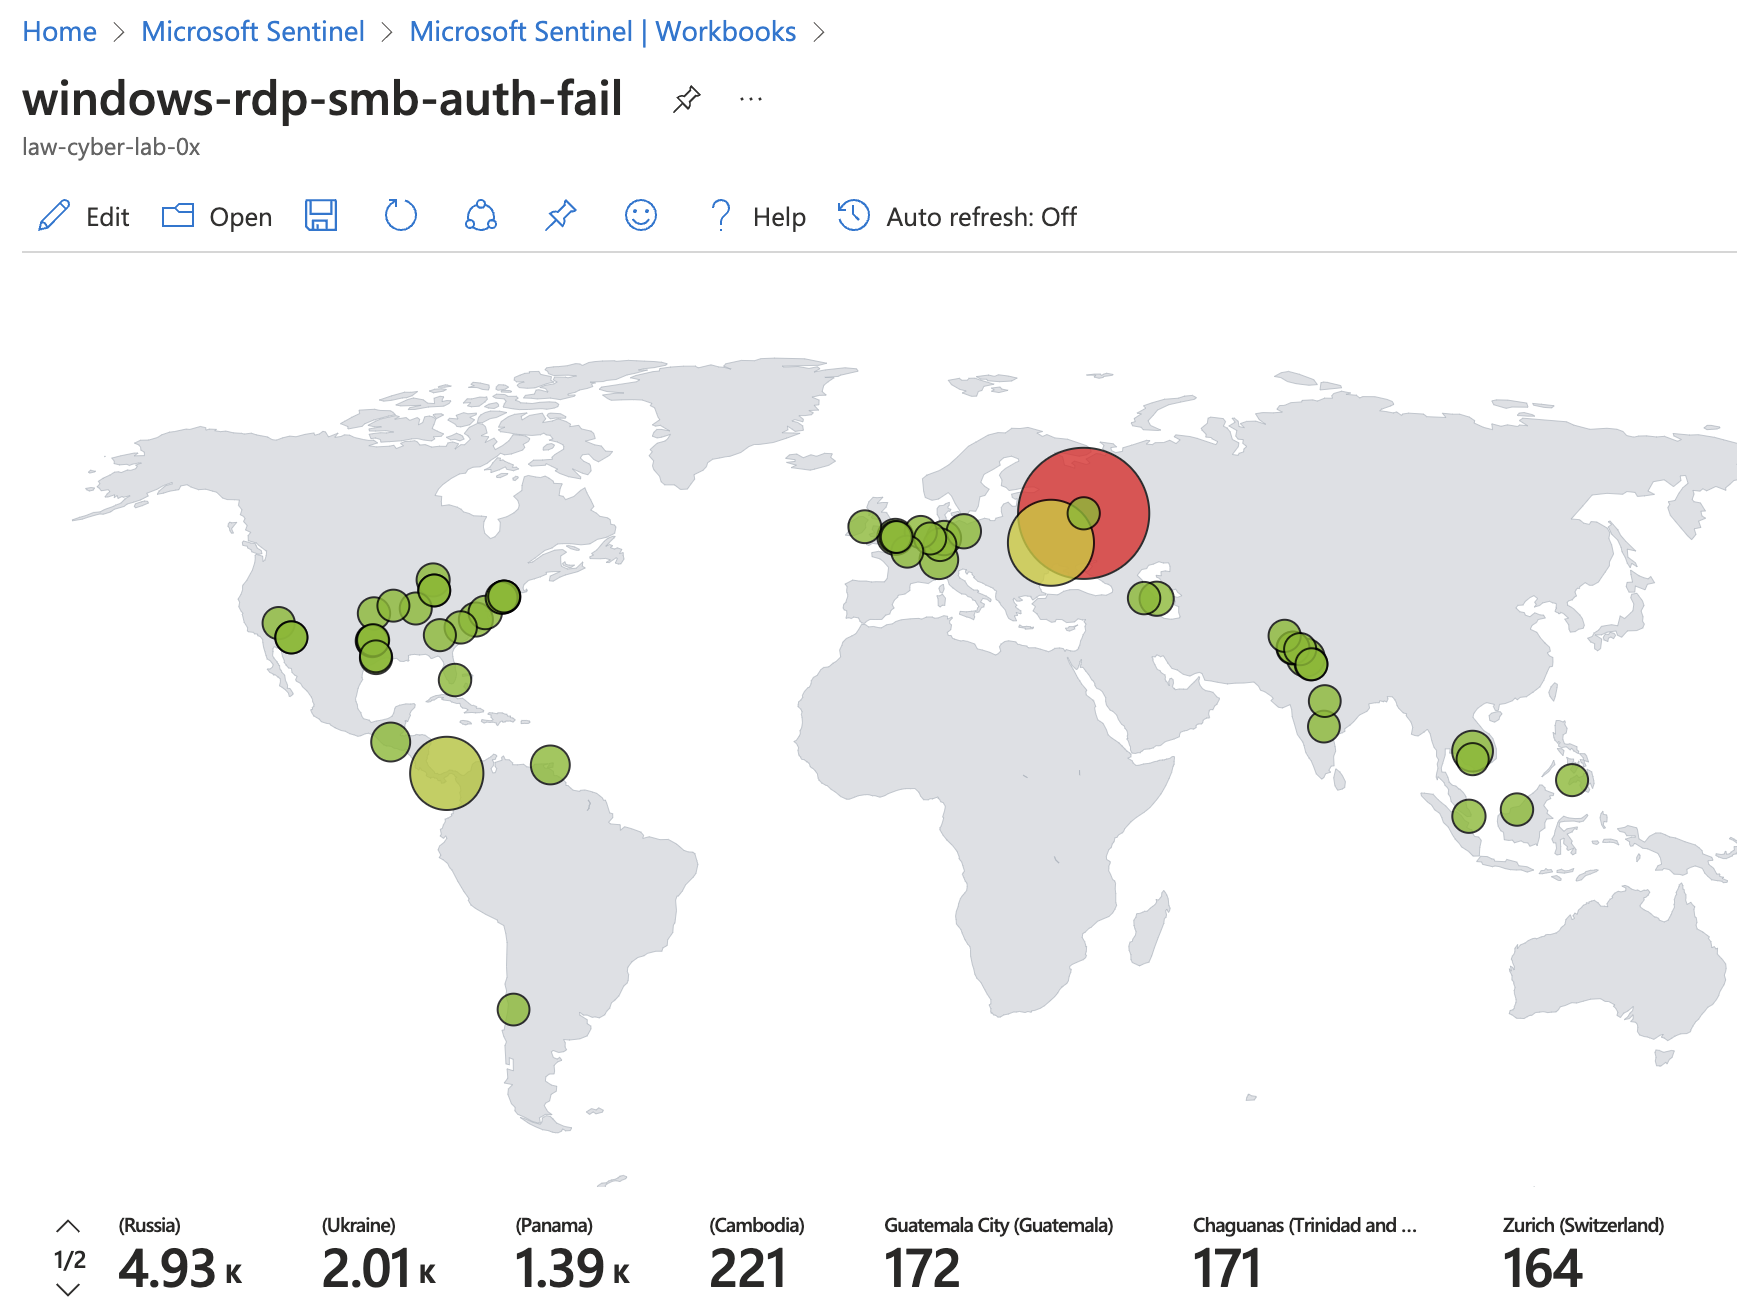
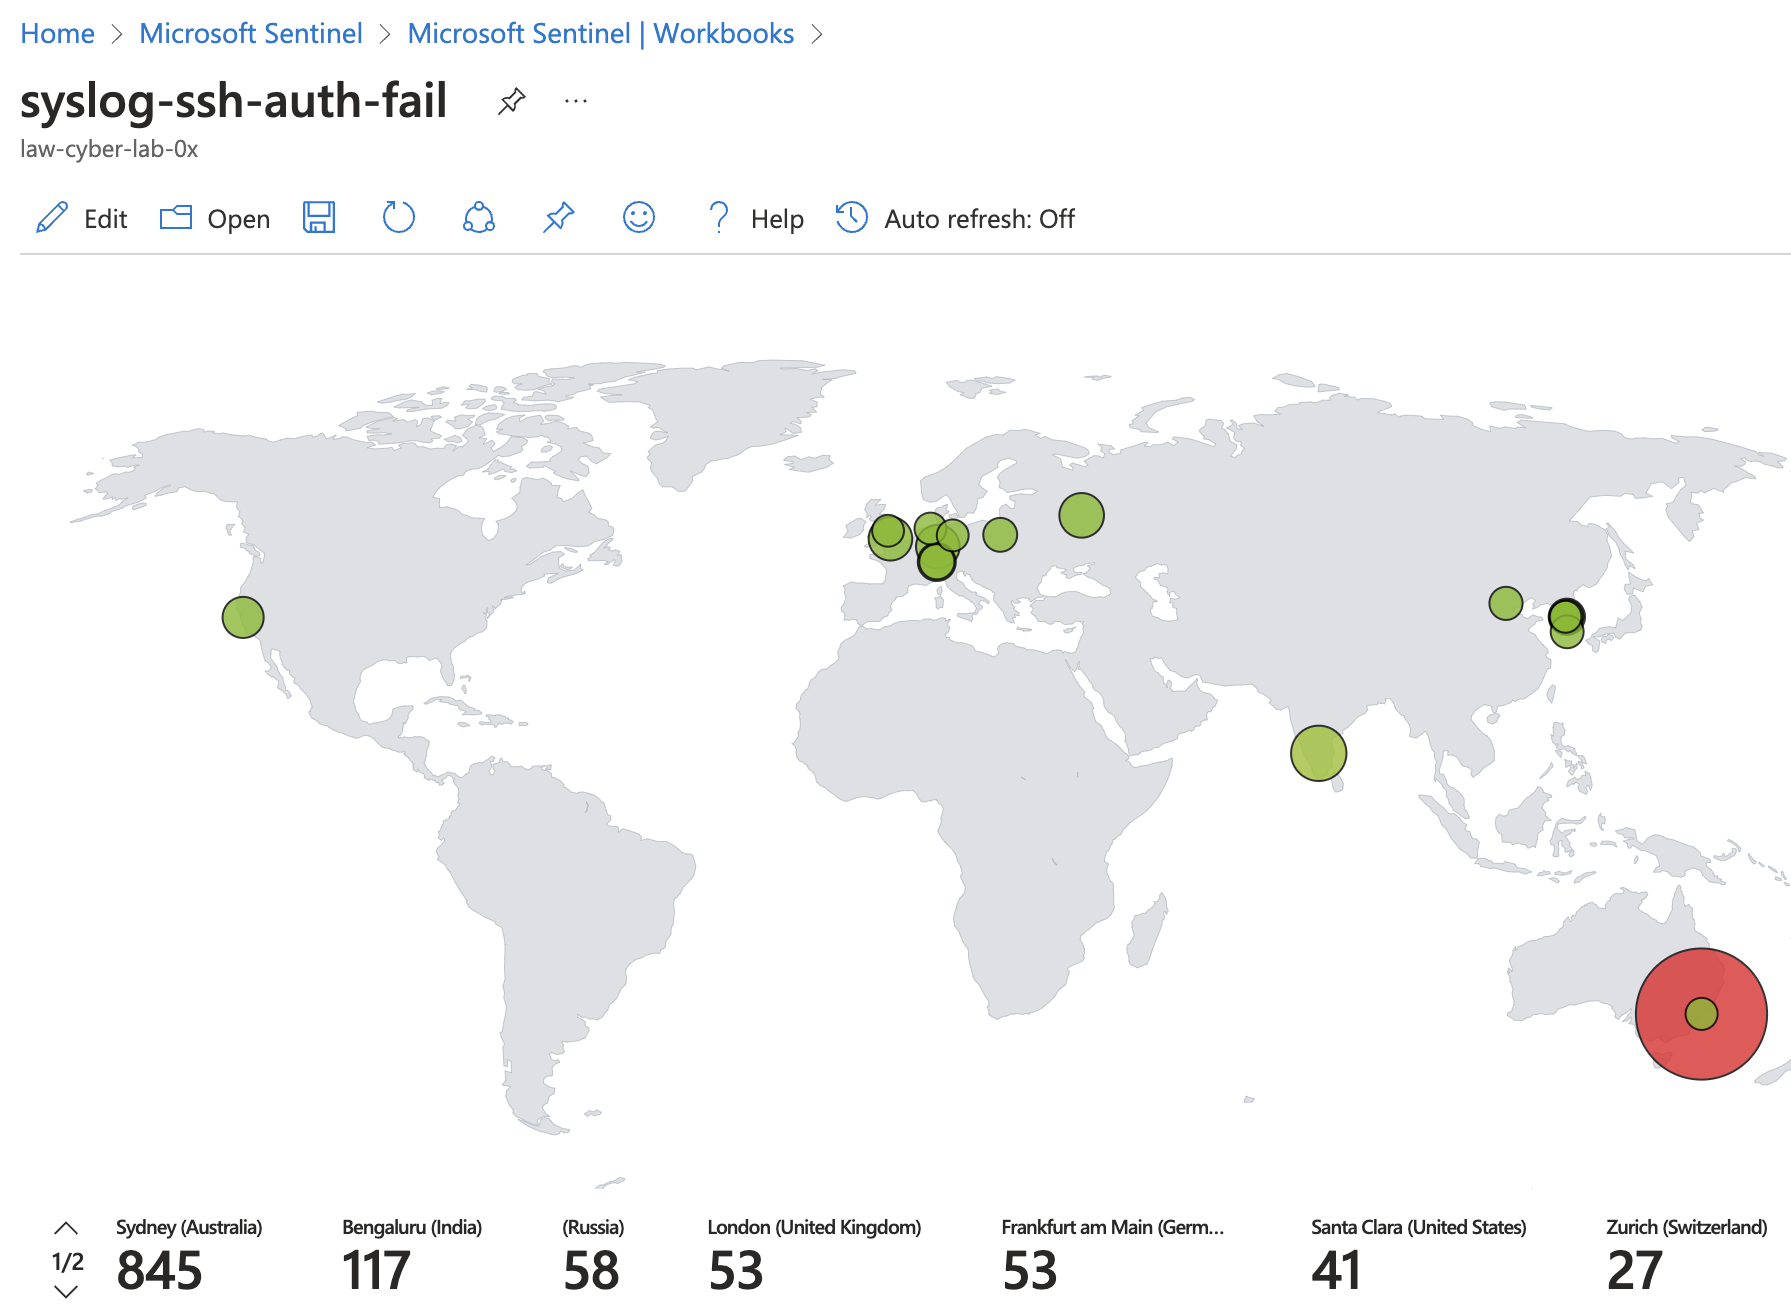
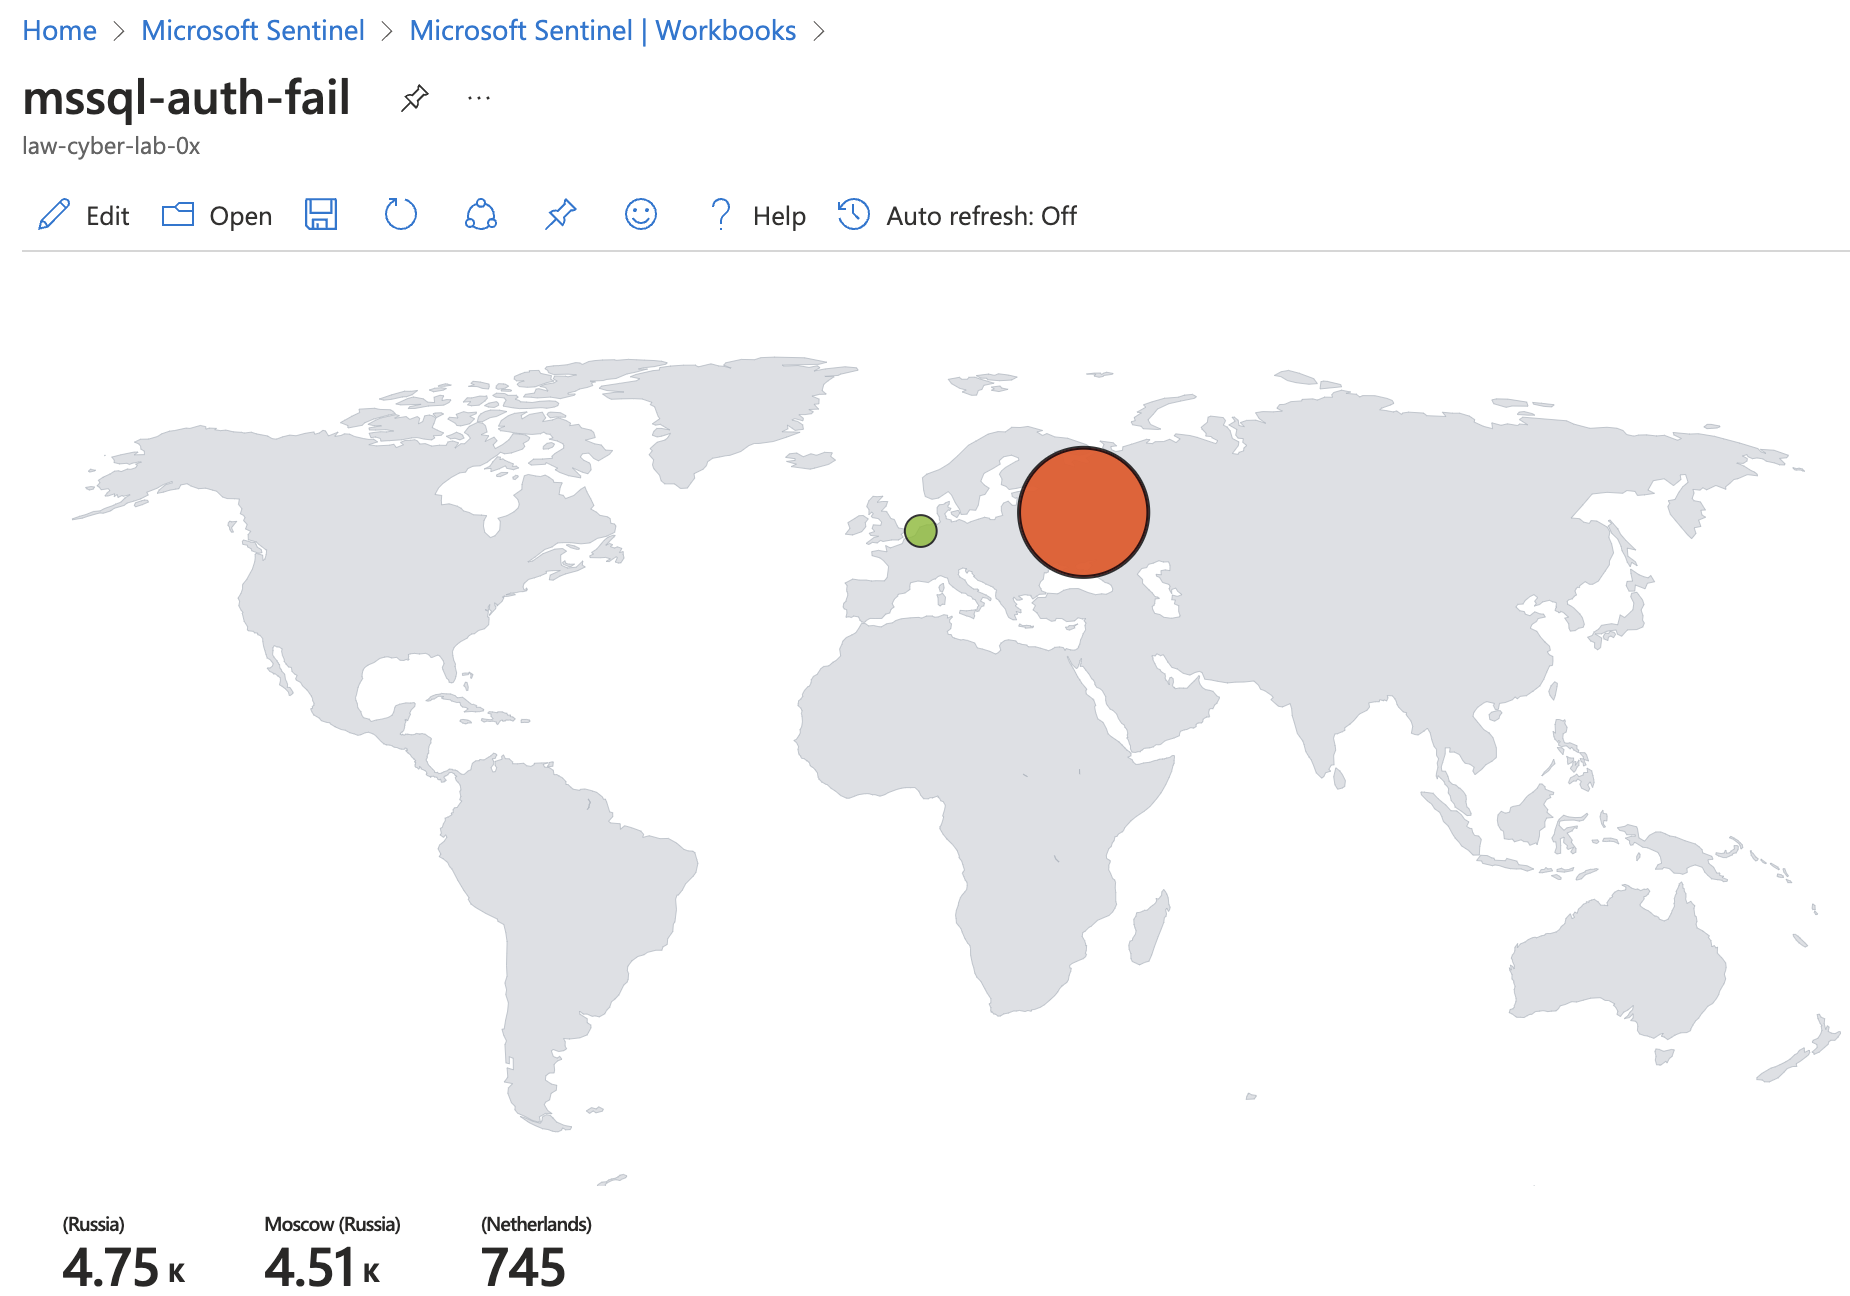
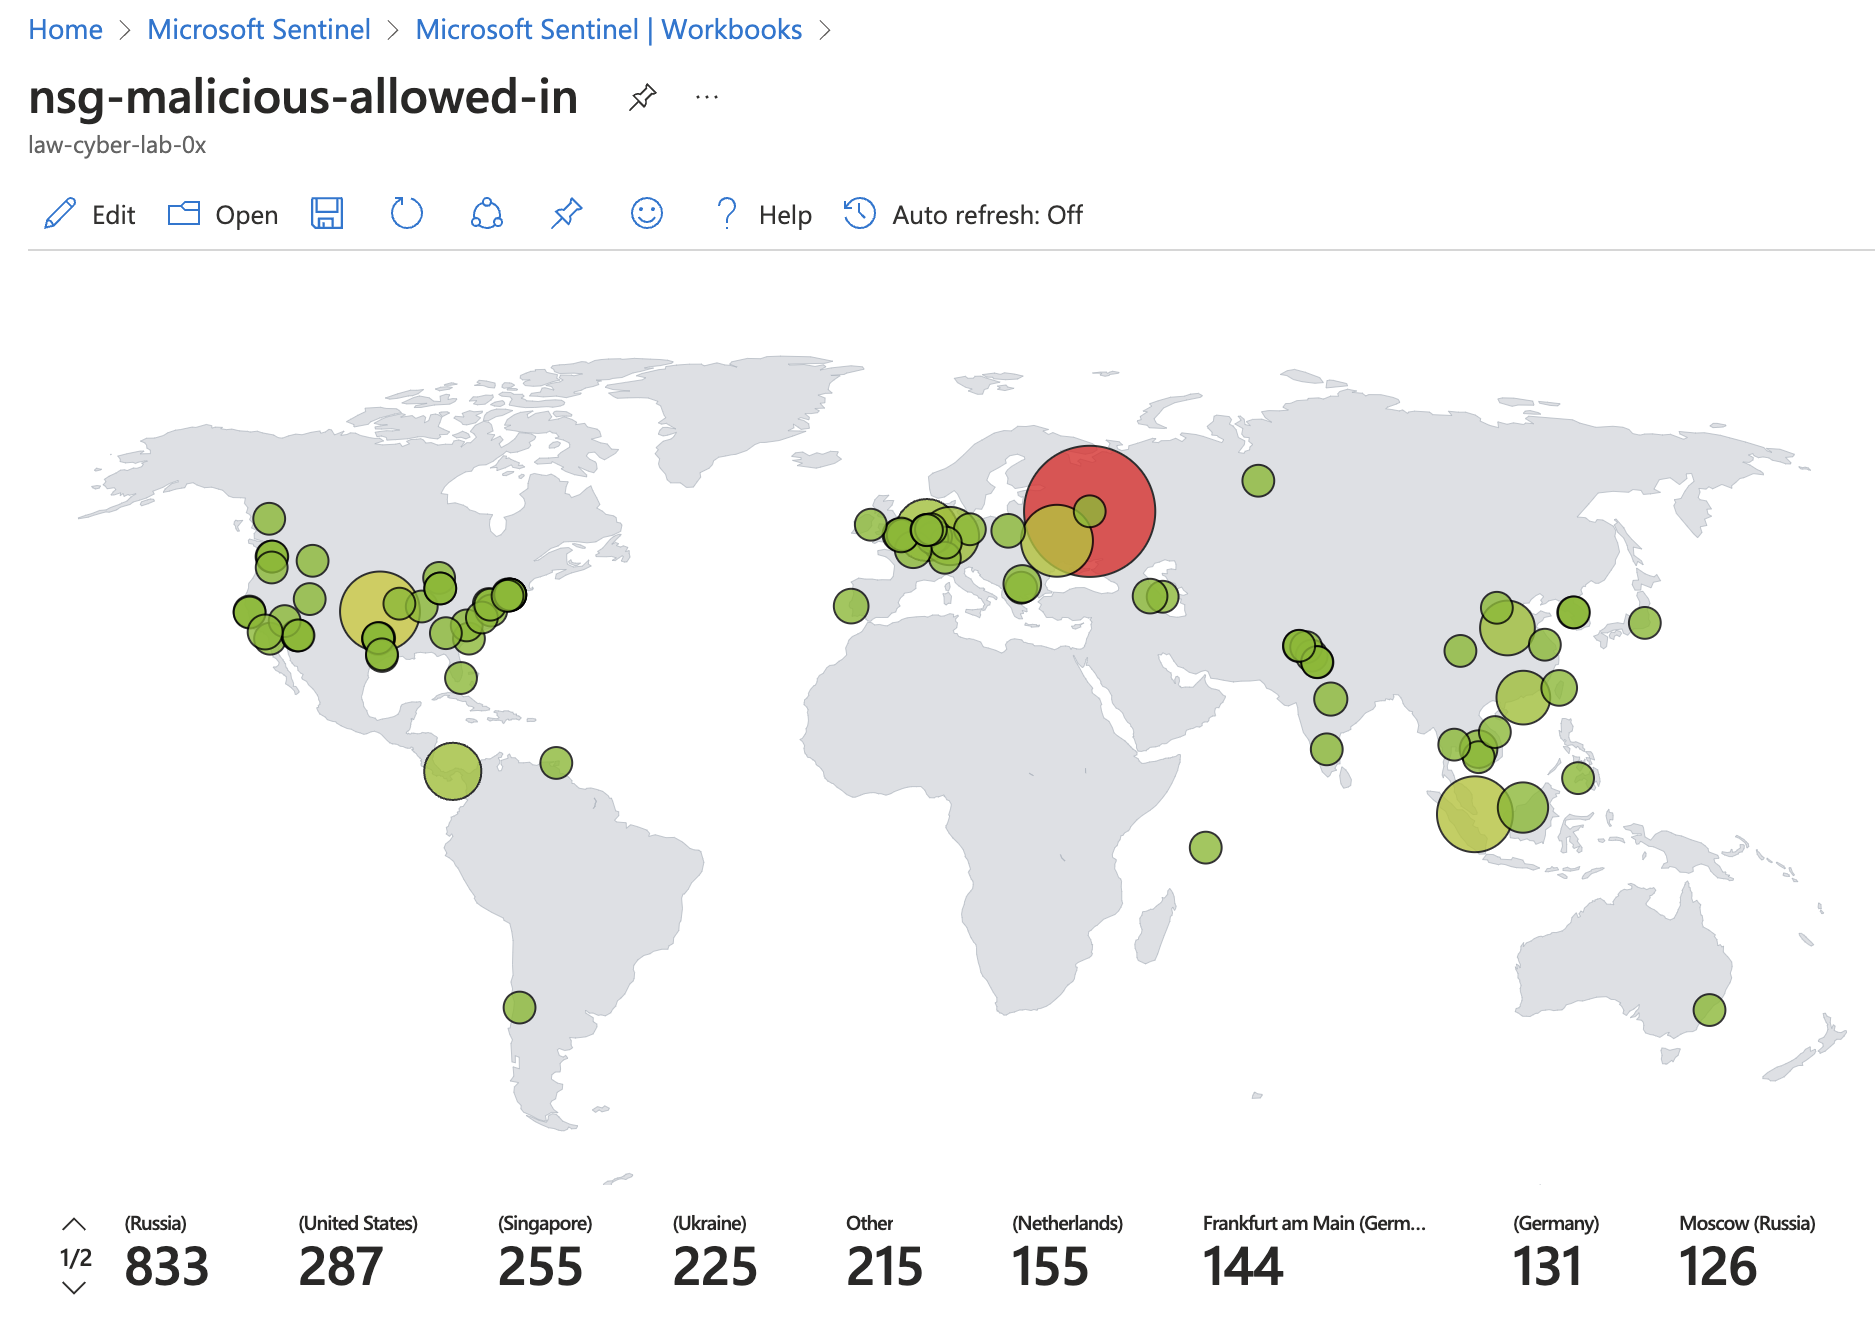
Attack maps
Based upon the IPs of the incoming connections related to the security events,
Windows-VMs: RDP / SMB / General authentication failures
Linux-VMs: SSH authentication failures
Azure SQL server: authentication failures
Network Security Groups: malicious flows
Measures taken
In broad terms, the containment measures entailed:
- adding regulatory compliancy standards to MDC
- disabling key vault and storage public access
- creating private endpoint for all resources
- creating a new NSG and attaching it to the existing subnet
NOTE: this project also involved the creation of custom analytic query rules for alerts that then created incidents, each of which was then met with an incident response in allignment with NIST 800-61. Given the level of detail that this part entailed, it merits its own post, still underway.
After hardening security controls
For the after metrics, Network Security Groups were hardened by blocking ALL traffic with the exception of my admin workstation, and all other resources were protected by their built-in firewalls as well as Private Endpoint.
Metrics after hardening
| Metric | Value |
|---|---|
| Start time | 2023-08-08T16:18:28.5082029Z |
| Stop time | 2023-08-09T16:18:28.5082029Z |
| Security events (Windows-VMs) | 12 657 (-86%) |
| Syslog (Linux-VMs) | 1 (-99.97%) |
| Security Alert (MS Defender for Cloud) | 0 |
| Security Incident (Sentinel) | 0 |
| NSG Inbound malcious flows allowed | 0 |
Conclusion
To recap, this project consisted in setting up a mini honeynet within Microsoft Azure and integrating log sources into the Log Analytics workspace. Then, using Microsoft Sentinel, I initiated alerts and established incidents from the received logs.
Before applying security controls, I assessed metrics in the vulnerable environment and then reassessed post-implementation.
Notably, there was a significant drop in security events and incidents post-security measures, indicating their value.
Future steps
This project containes numerous steps and touches many different aspects of network security that merit their own study given its complexity, such as the use of Kusto Query Language (KQL), Powershell scripting, the creation of custom analytics rules and the scpecificities of incident response as laid out in NIST's Incident Handling Guide (800-61).
That said, the plan is to write other posts drilling further in those details.